Altinity Cloud Manager Introduction
This section introduces the Altinity Cloud Manager for managing ClickHouse® clusters. The Altinity Cloud Manager (ACM) is where your existing clusters are shown. The ACM has features for managing environments, accounts, billing, and other useful things, but we’ll just focus on the Clusters tab here.
The Clusters (plural) view
You’ll spend most of your time in the Clusters view:

Figure 1 – The Altinity Cloud Manager (ACM) home screen with no clusters running
In this image, altinity-maddie-byok is the name of the environment you’re in, Doug Tidwell is your username, and currently there aren’t any clusters running in this environment.
The Launch Cluster button makes it easy to create a new ClickHouse cluster, If you want to create a ClickHouse cluster now and skip the rest of the tour, you can go directly to our coverage of the Launch Cluster wizard.
Here’s what the Clusters view looks like when you have at least one ClickHouse cluster. Our clusters are named cluster2 and maddie-byok. By default, they appear in the Panel view:

Figure 2 – The Panel view of two clusters
Notice that in Figure 2 the  Panel view icon is selected in the upper right. Click the
  List view icon to switch to the more compact List view:

Figure 3 – The List view of two clusters
Whether you’re in Panel view or List view, clicking on the name of a cluster takes you to the Cluster details view.
The Cluster (singular) view
The Cluster details view looks like this:

Figure 4 – Cluster details for the maddie-byok cluster
It also has dropdown menus for ACTIONS (things like stopping or starting or deleting the cluster) and CONFIGURE (things like backup schedules and uptime settings). We cover those in the sections Cluster actions and Configuring a cluster, respectively.
Connection details
The cluster details view includes a link to the Connection Details for this cluster; that contains all the details you need to connect to the cluster from your application code, a monitoring tool, or the command line.
Clicking the Connection Details link in Figure 4 gives you a panel with all the details you need to work with your ClickHouse cluster:

Figure 5 - Connection details for this cluster
For complete details, see the Cluster Connection Details page in the Connecting to Altinity.Cloud section.
Grafana monitoring view
From the Cluster Details view, selecting the View in Grafana link shows the Grafana menu:

Figure 6 - The Grafana menu
Selecting the Cluster Metrics menu displays this Grafana dashboard:
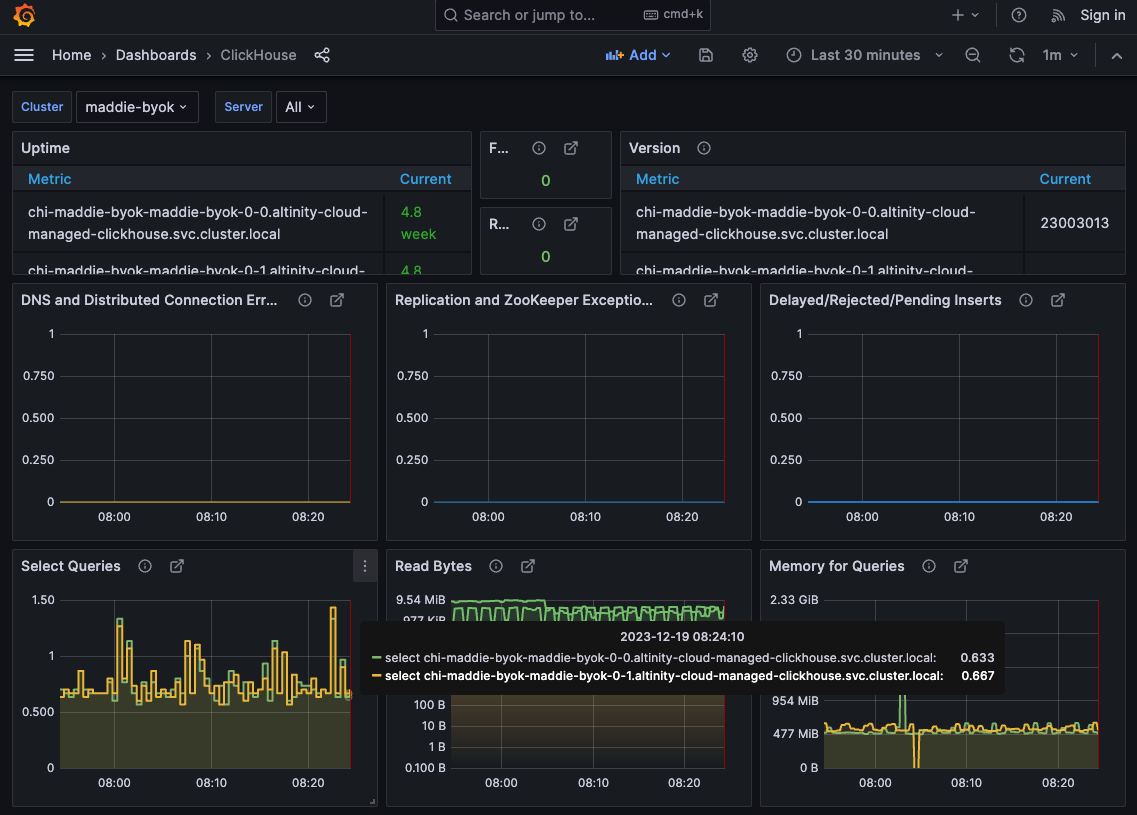
Figure 7 – The Grafana dashboard for the ClickHouse cluster maddie_byok in the environment altinity-maddie-byok
Scrolling down the dashboard displays roughly a dozen other visualizations of data for the maddie-byok cluster. As you would expect, you can see data for individual clusters or all clusters combined.
The other Grafana dashboards let you see system metrics, a history of your queries and their performance, and all the messages from your logs. See the Grafana dashboards documentation for complete details.
The Cluster Explorer
While viewing your cluster, selecting the  button displays the Query tab in the Cluster Explorer. This lets you run SQL queries against the data in your ClickHouse cluster.

Figure 8 – The Cluster Explorer Query tab
The explorer has additional tabs for Schema, Workload, DBA Tools, and API Endpoints at the top of the screen. You can also import a sample dataset into your ClickHouse cluster. We cover all of these features in detail in the Cluster Explorer Guide.