Create Charts from ClickHouse® Data
Once Superset has been installed and connected to ClickHouse, new charts can be created that draw their visualizations from the ClickHouse data.
For complete details on Superset dashboards and charts, see the Superset Creating Your First Dashboard site.
The following procedures demonstrate two methods of adding charts connected to ClickHouse data:
- From a physical dataset tied to a specific database table.
- From a virtual dataset tied to a query saved in SQL Lab.
Create a Chart from a Physical Dataset
Physical Dataset Chart Prerequisites
Before adding a new chart in Superset from ClickHouse data, Superset must be connected to ClickHouse. See Connect Superset to ClickHouse for more information.
Add a Physical Dataset Steps
To add a new Physical Dataset:
-
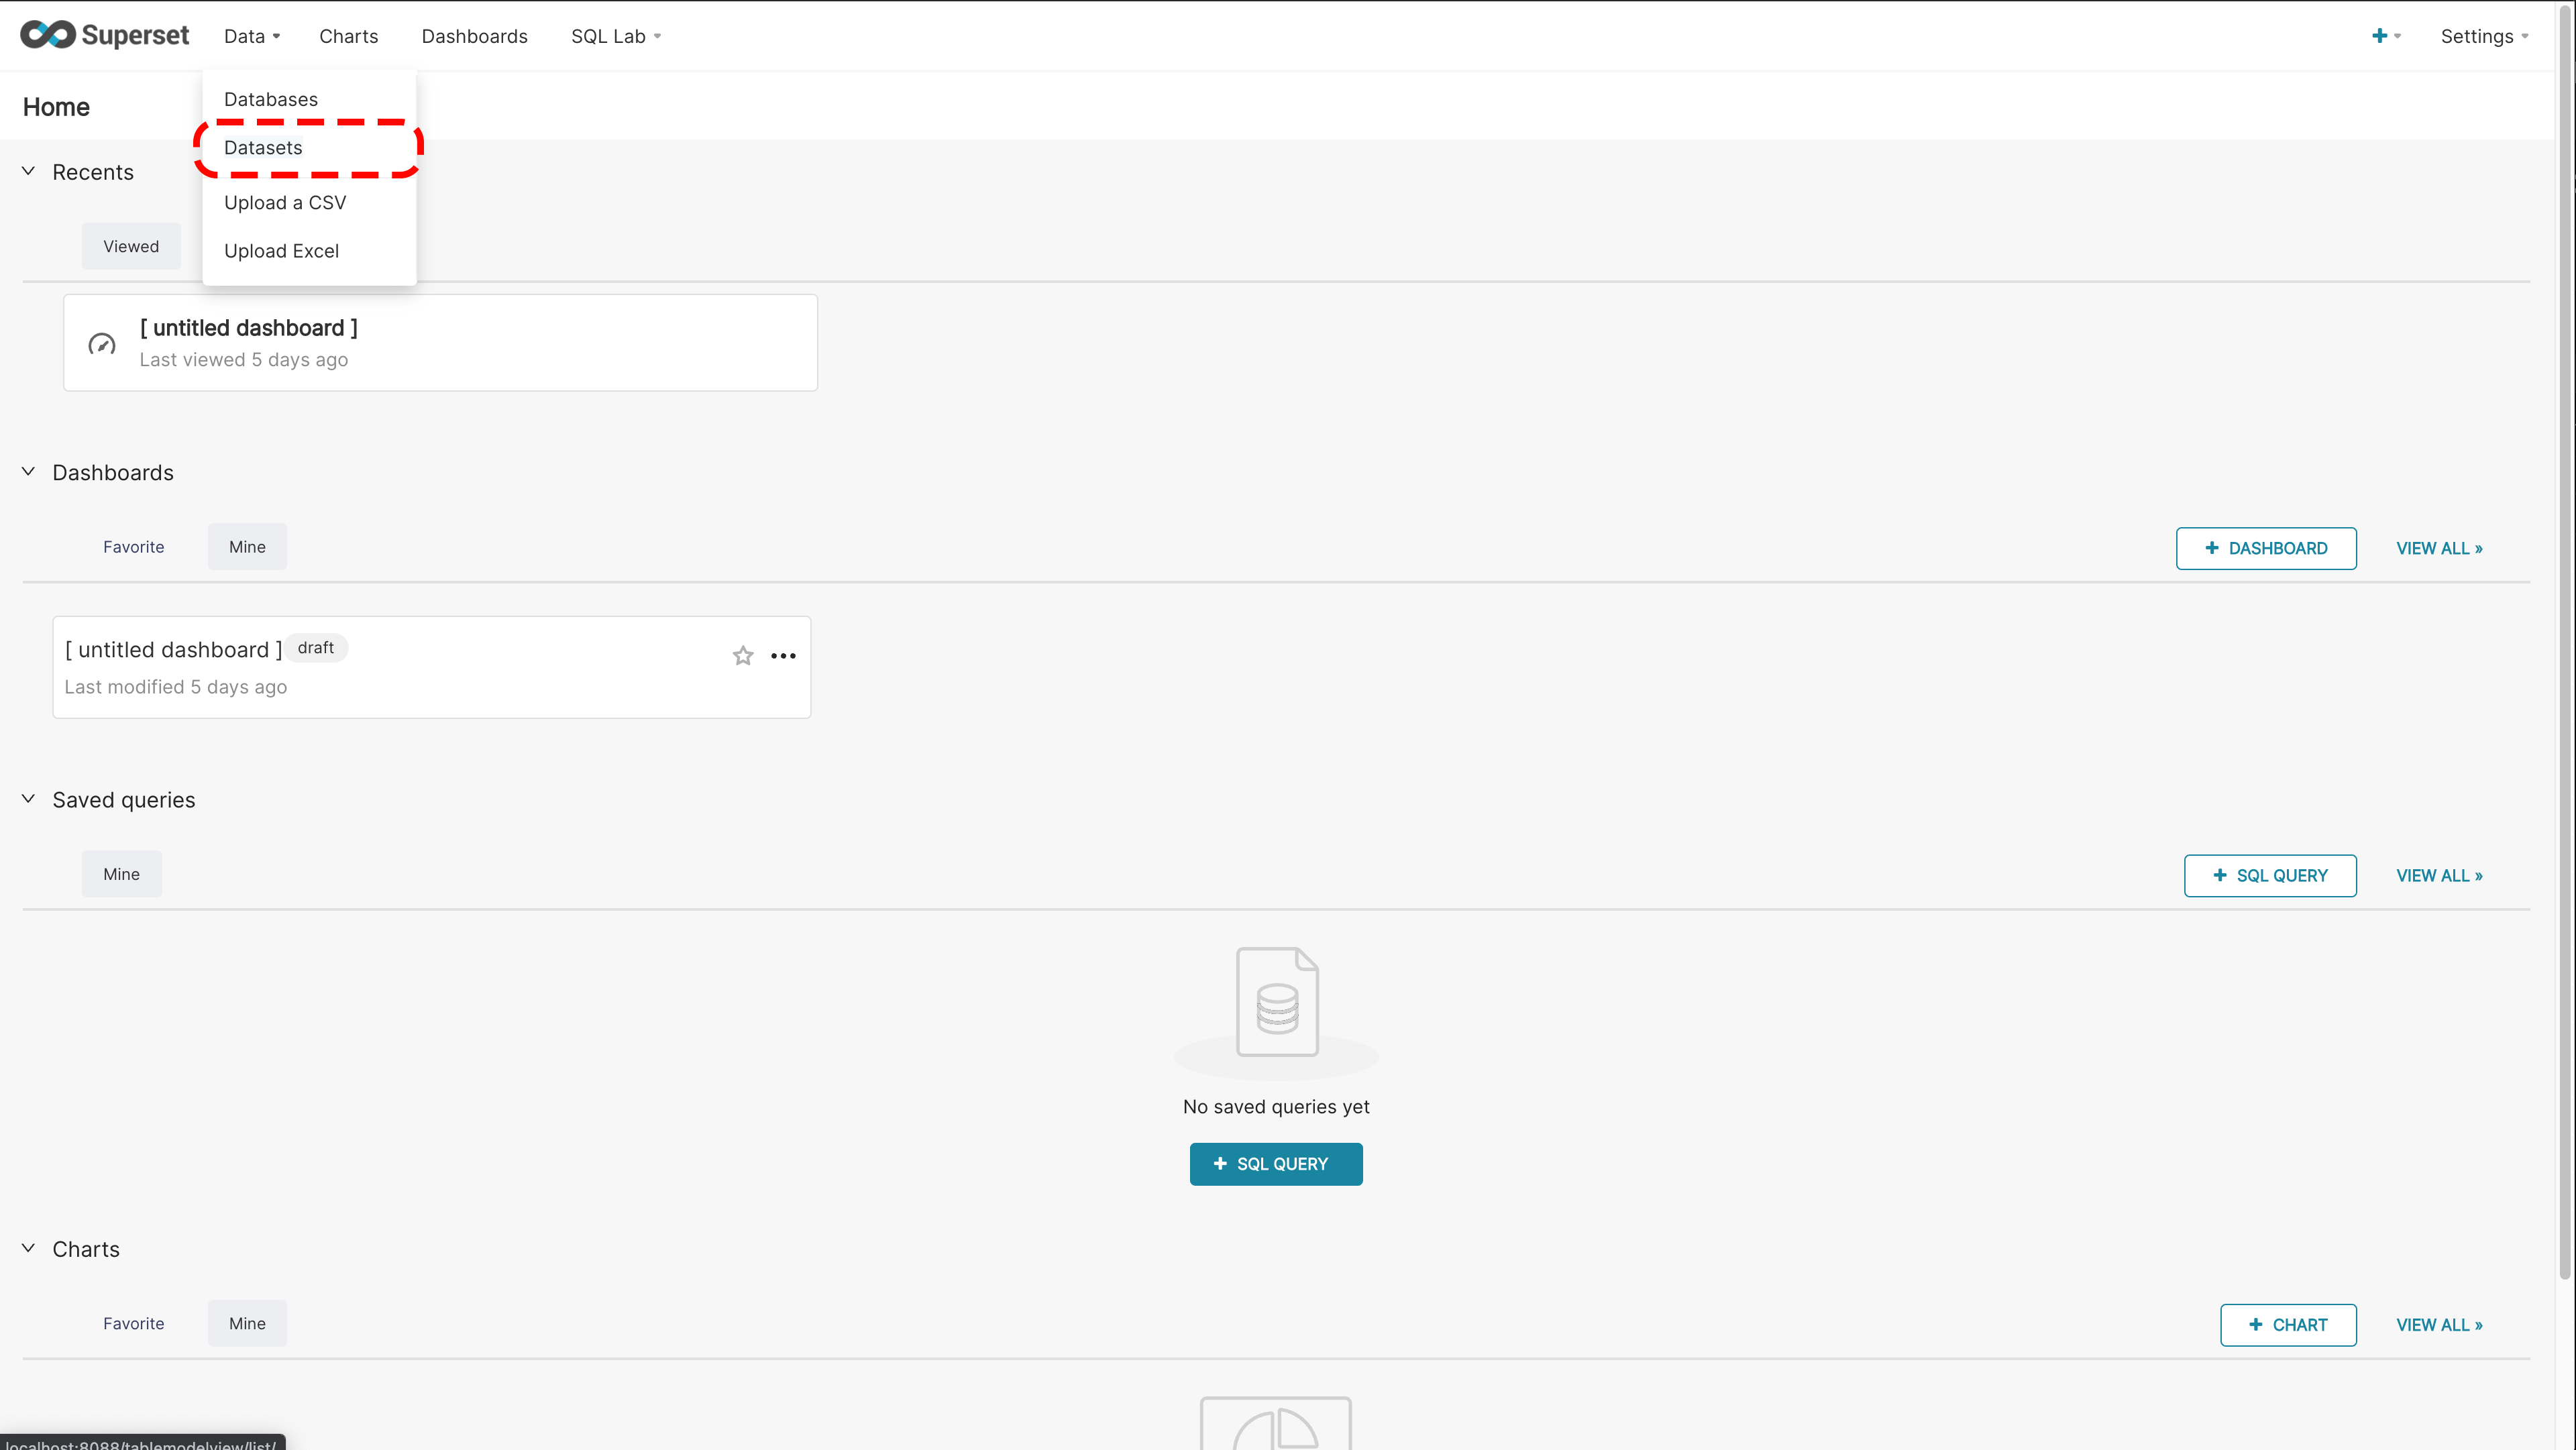
From the top menu, select Data->Datasets.
-
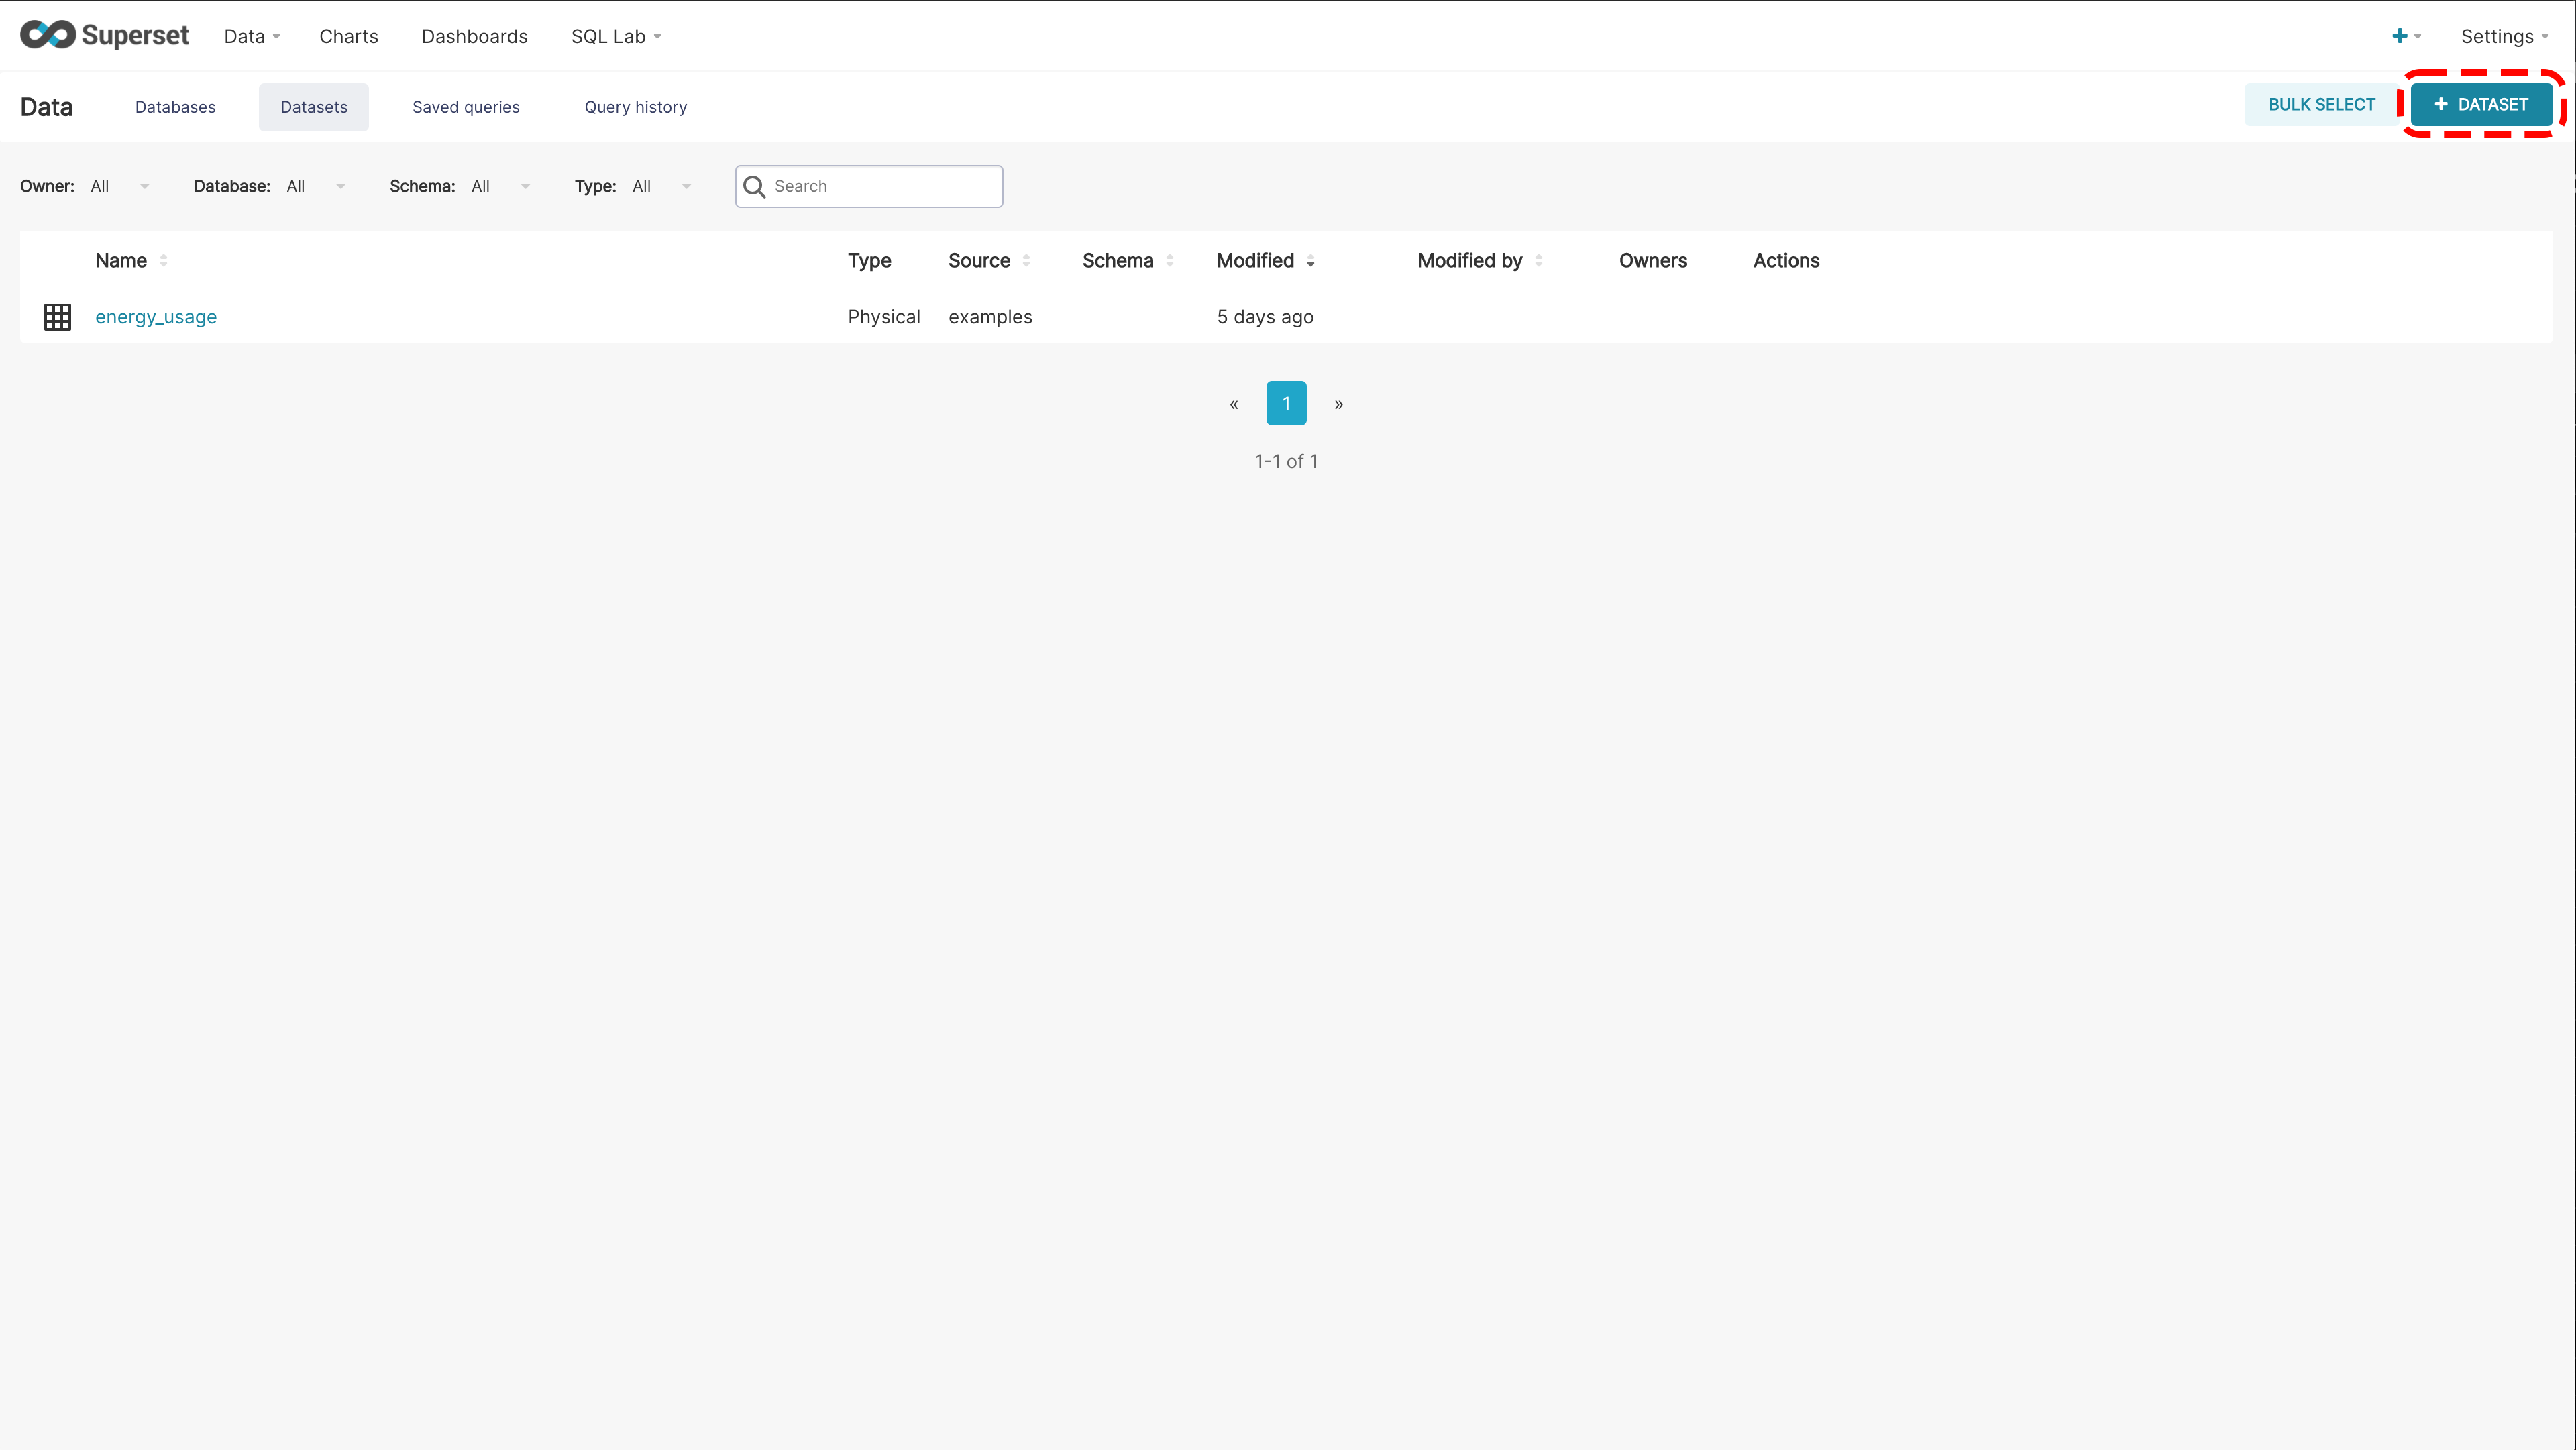
Select + Dataset.
-
Set the following:
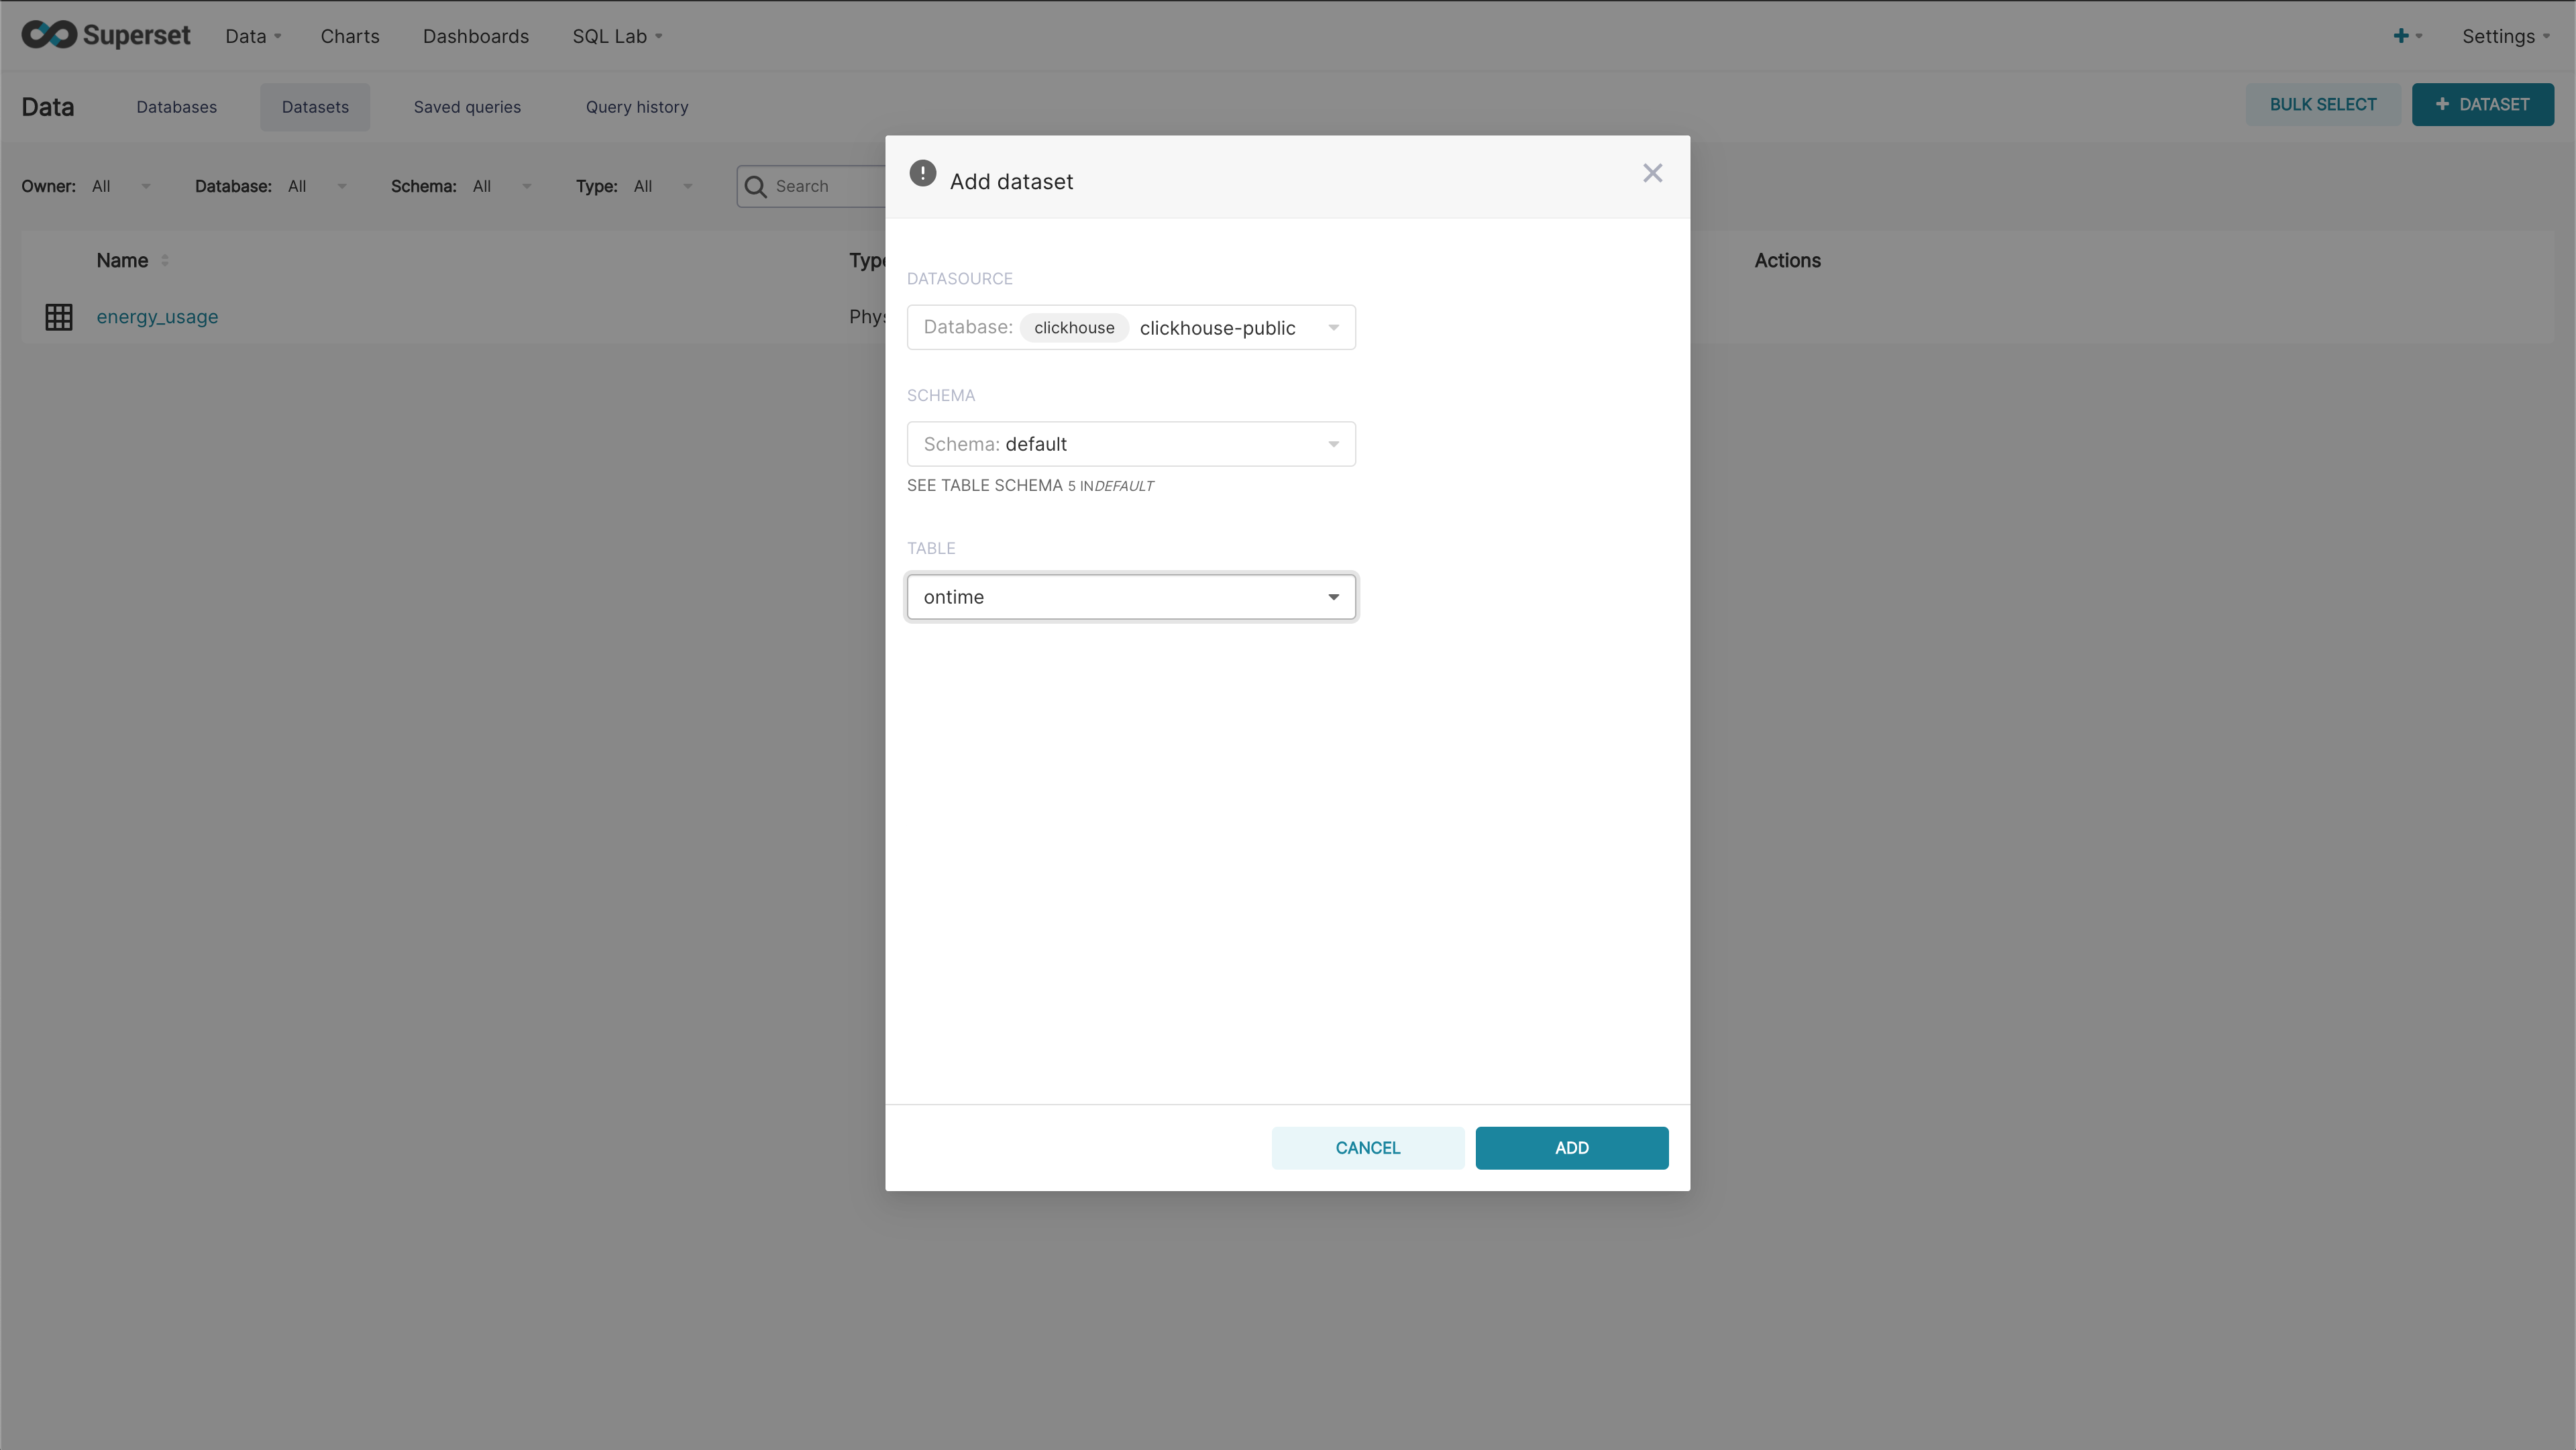
- Datasource: The connected ClickHouse database server to use.
- Schema: The database to use on the ClickHouse server.
- Table: The table to be queried.
Once complete, the physical dataset will be available for building new charts.
Chart from Standard Dataset Steps
To create a chart from a physical dataset:
-
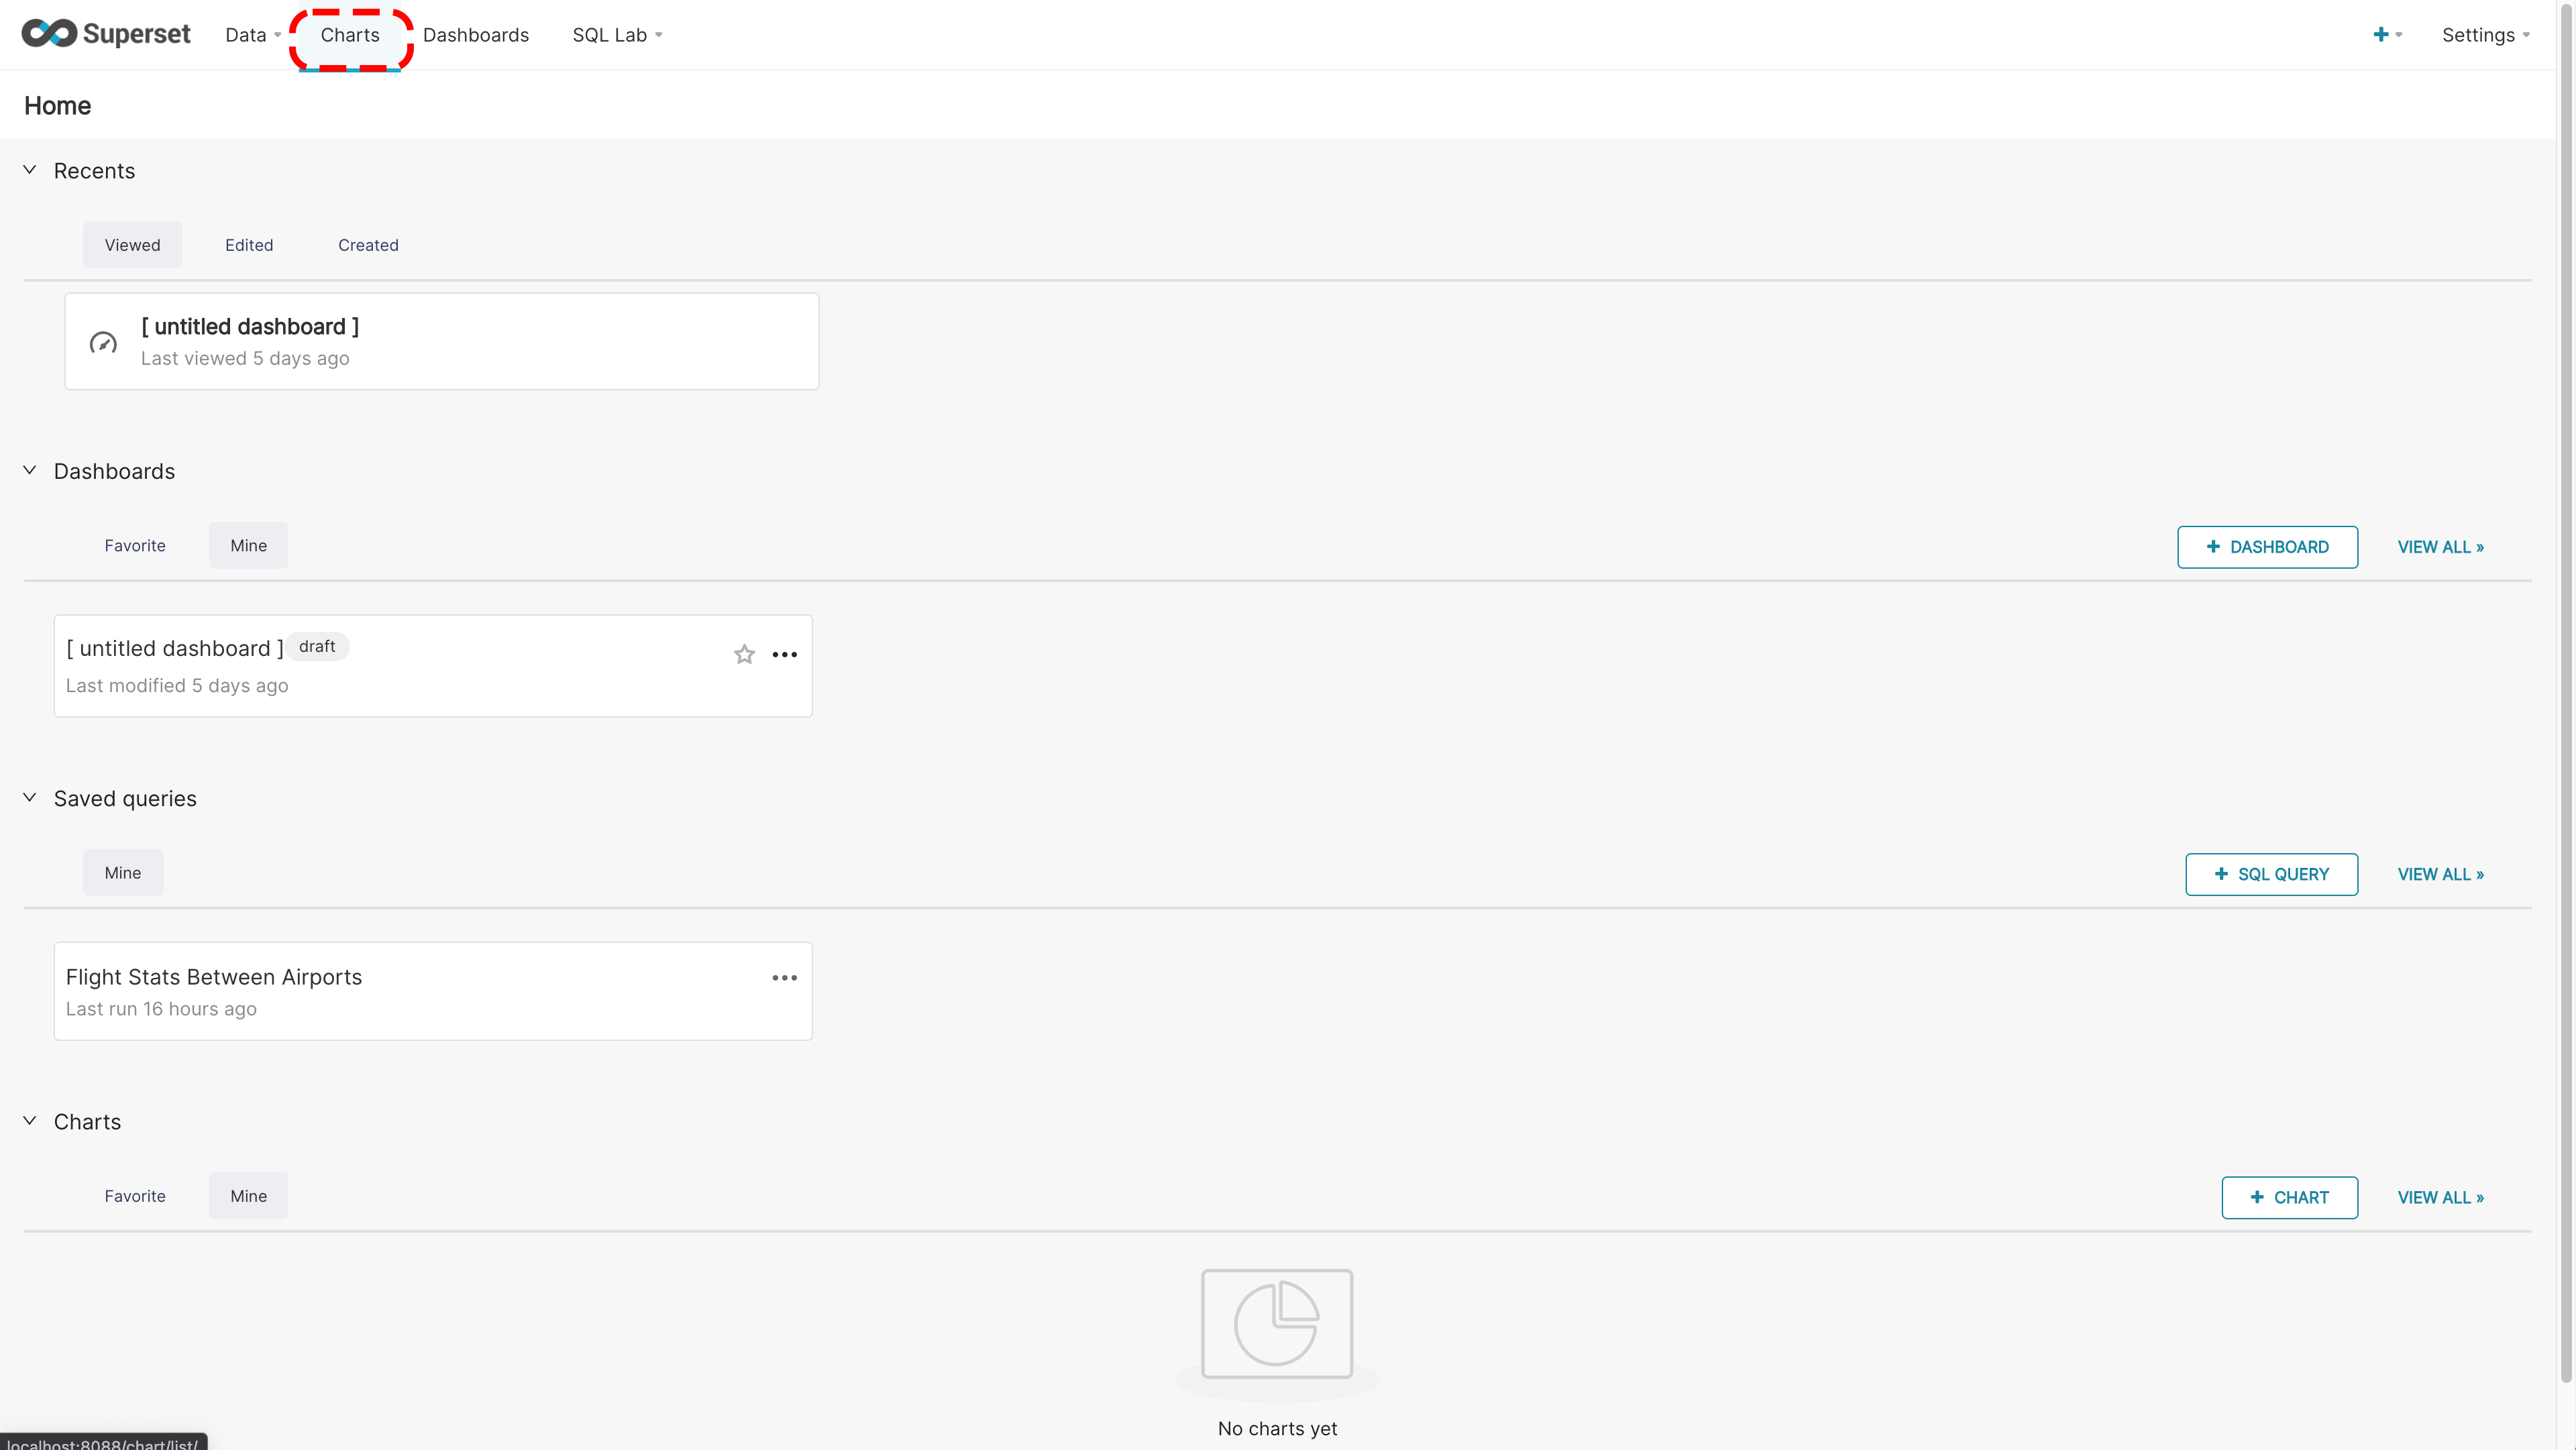
Select Charts from the top menu.
-
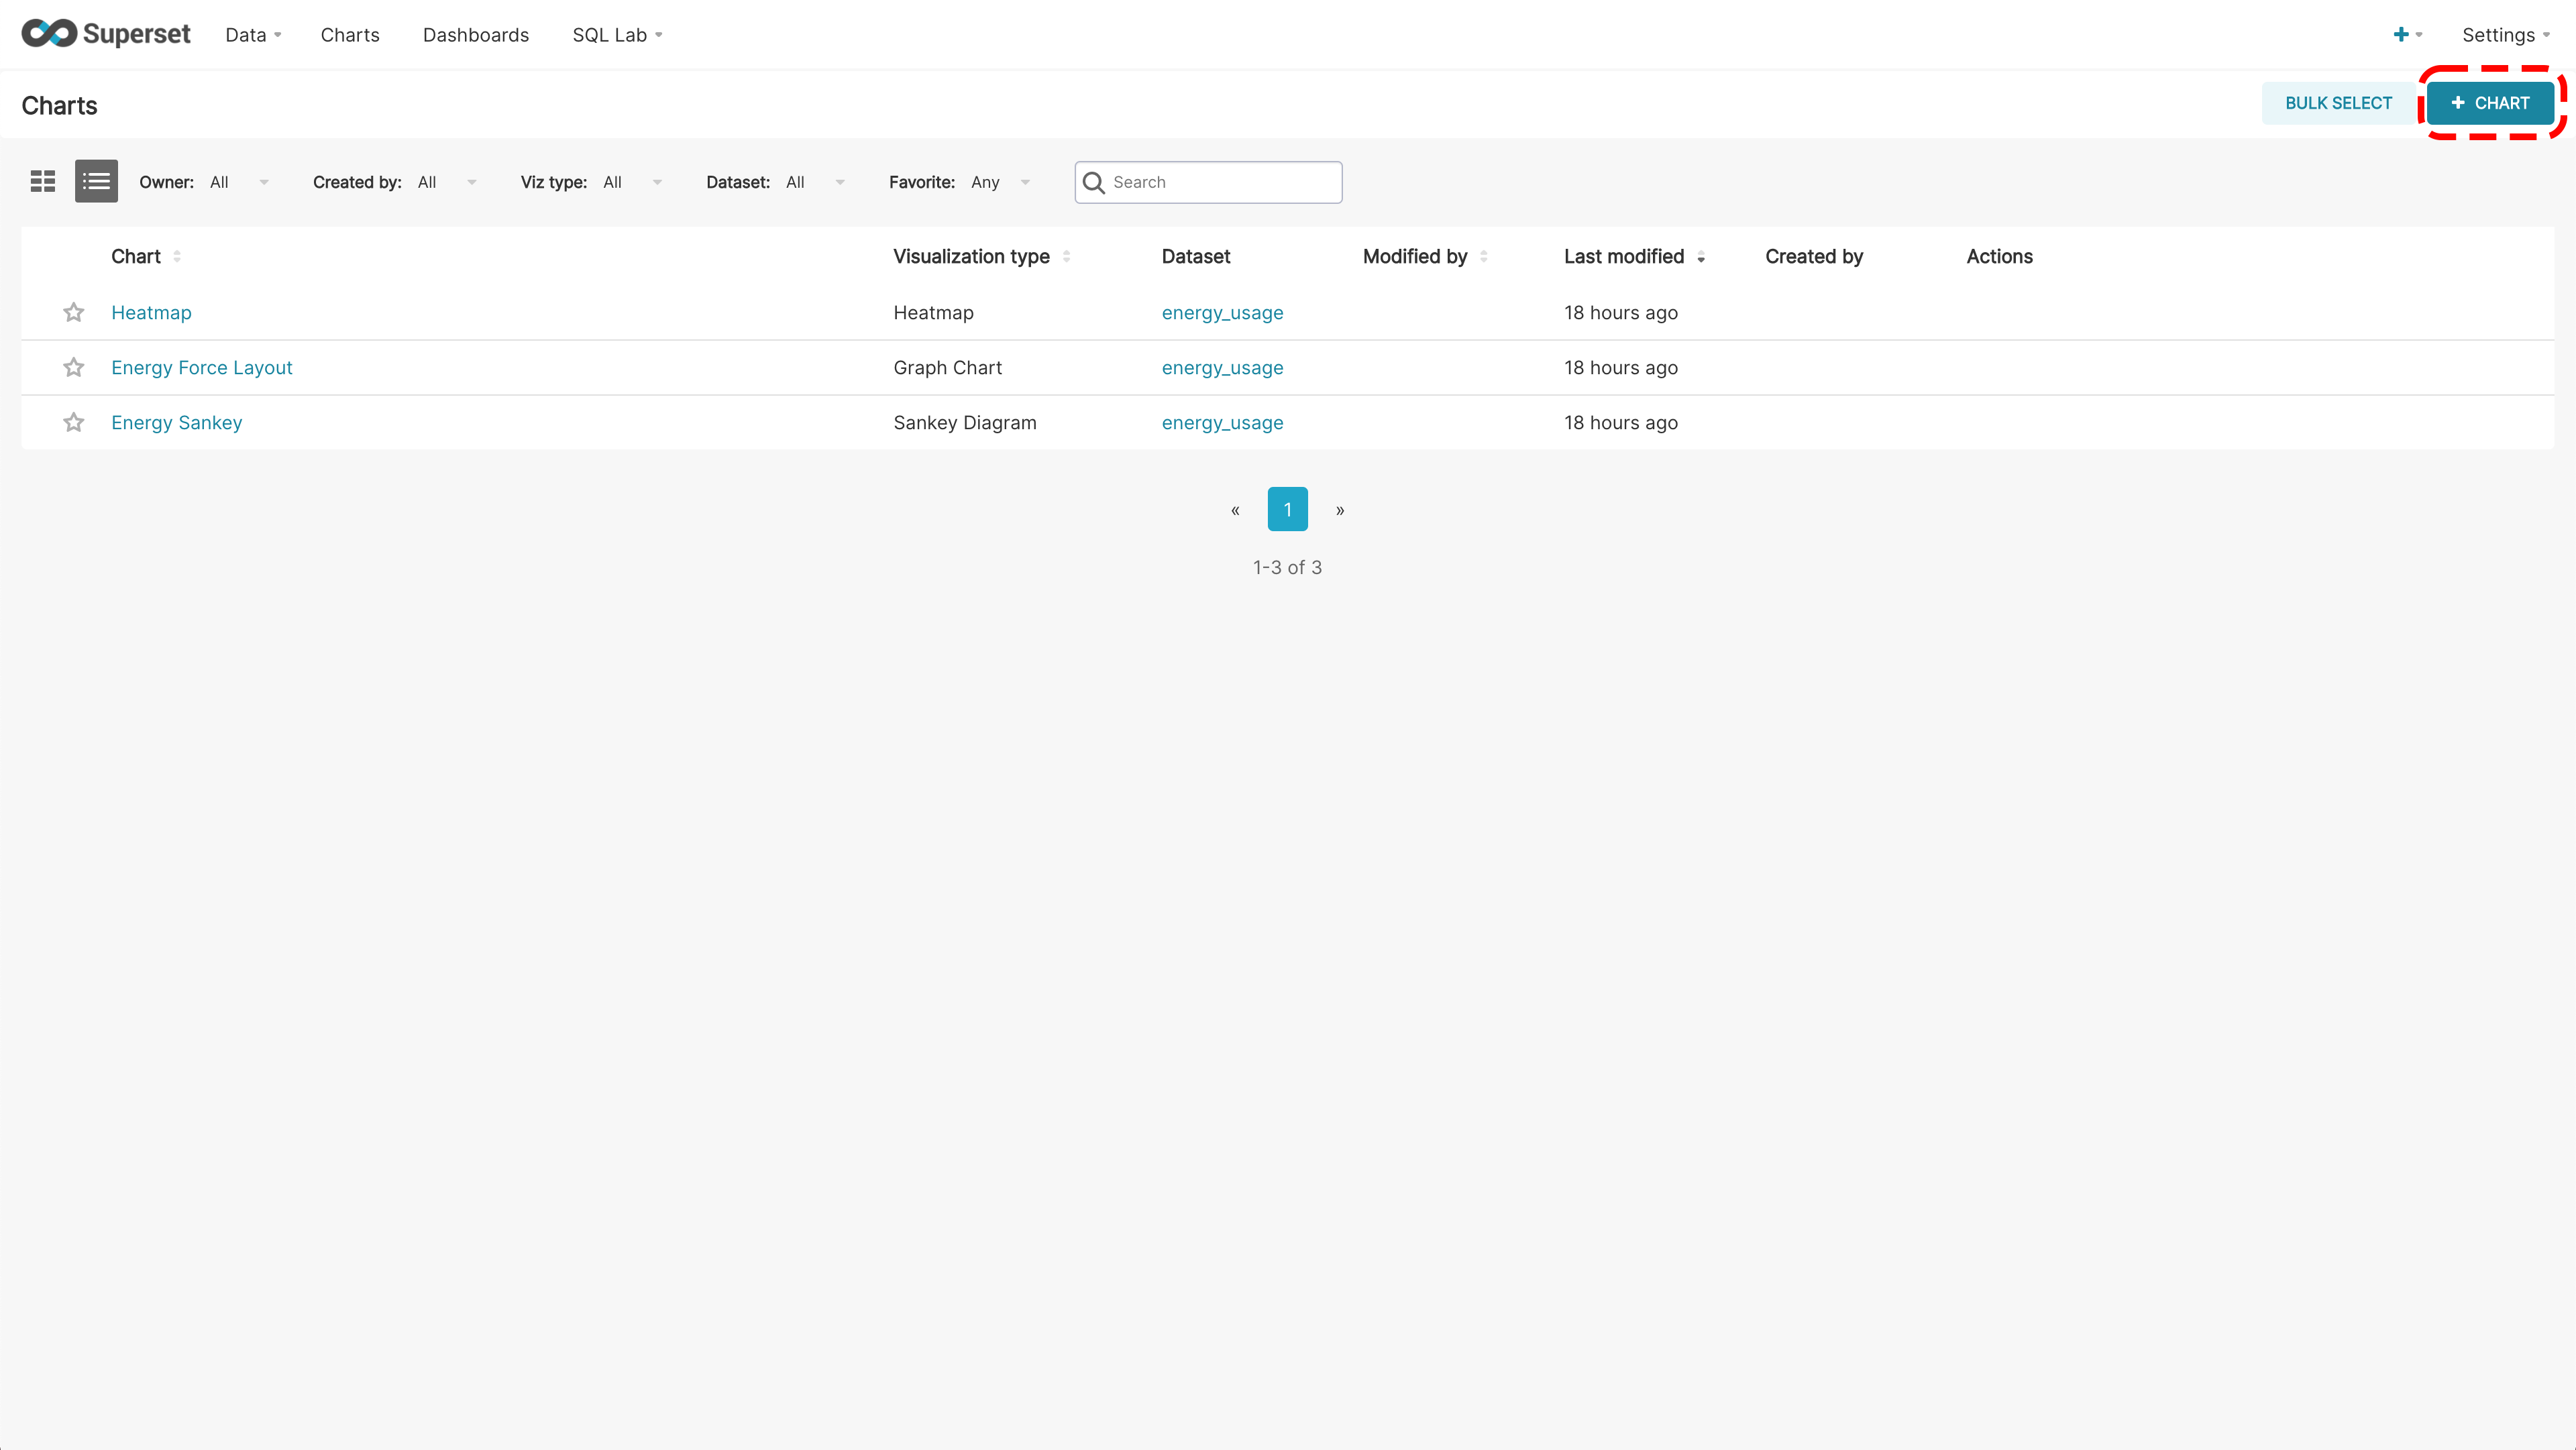
Select + Chart.
-
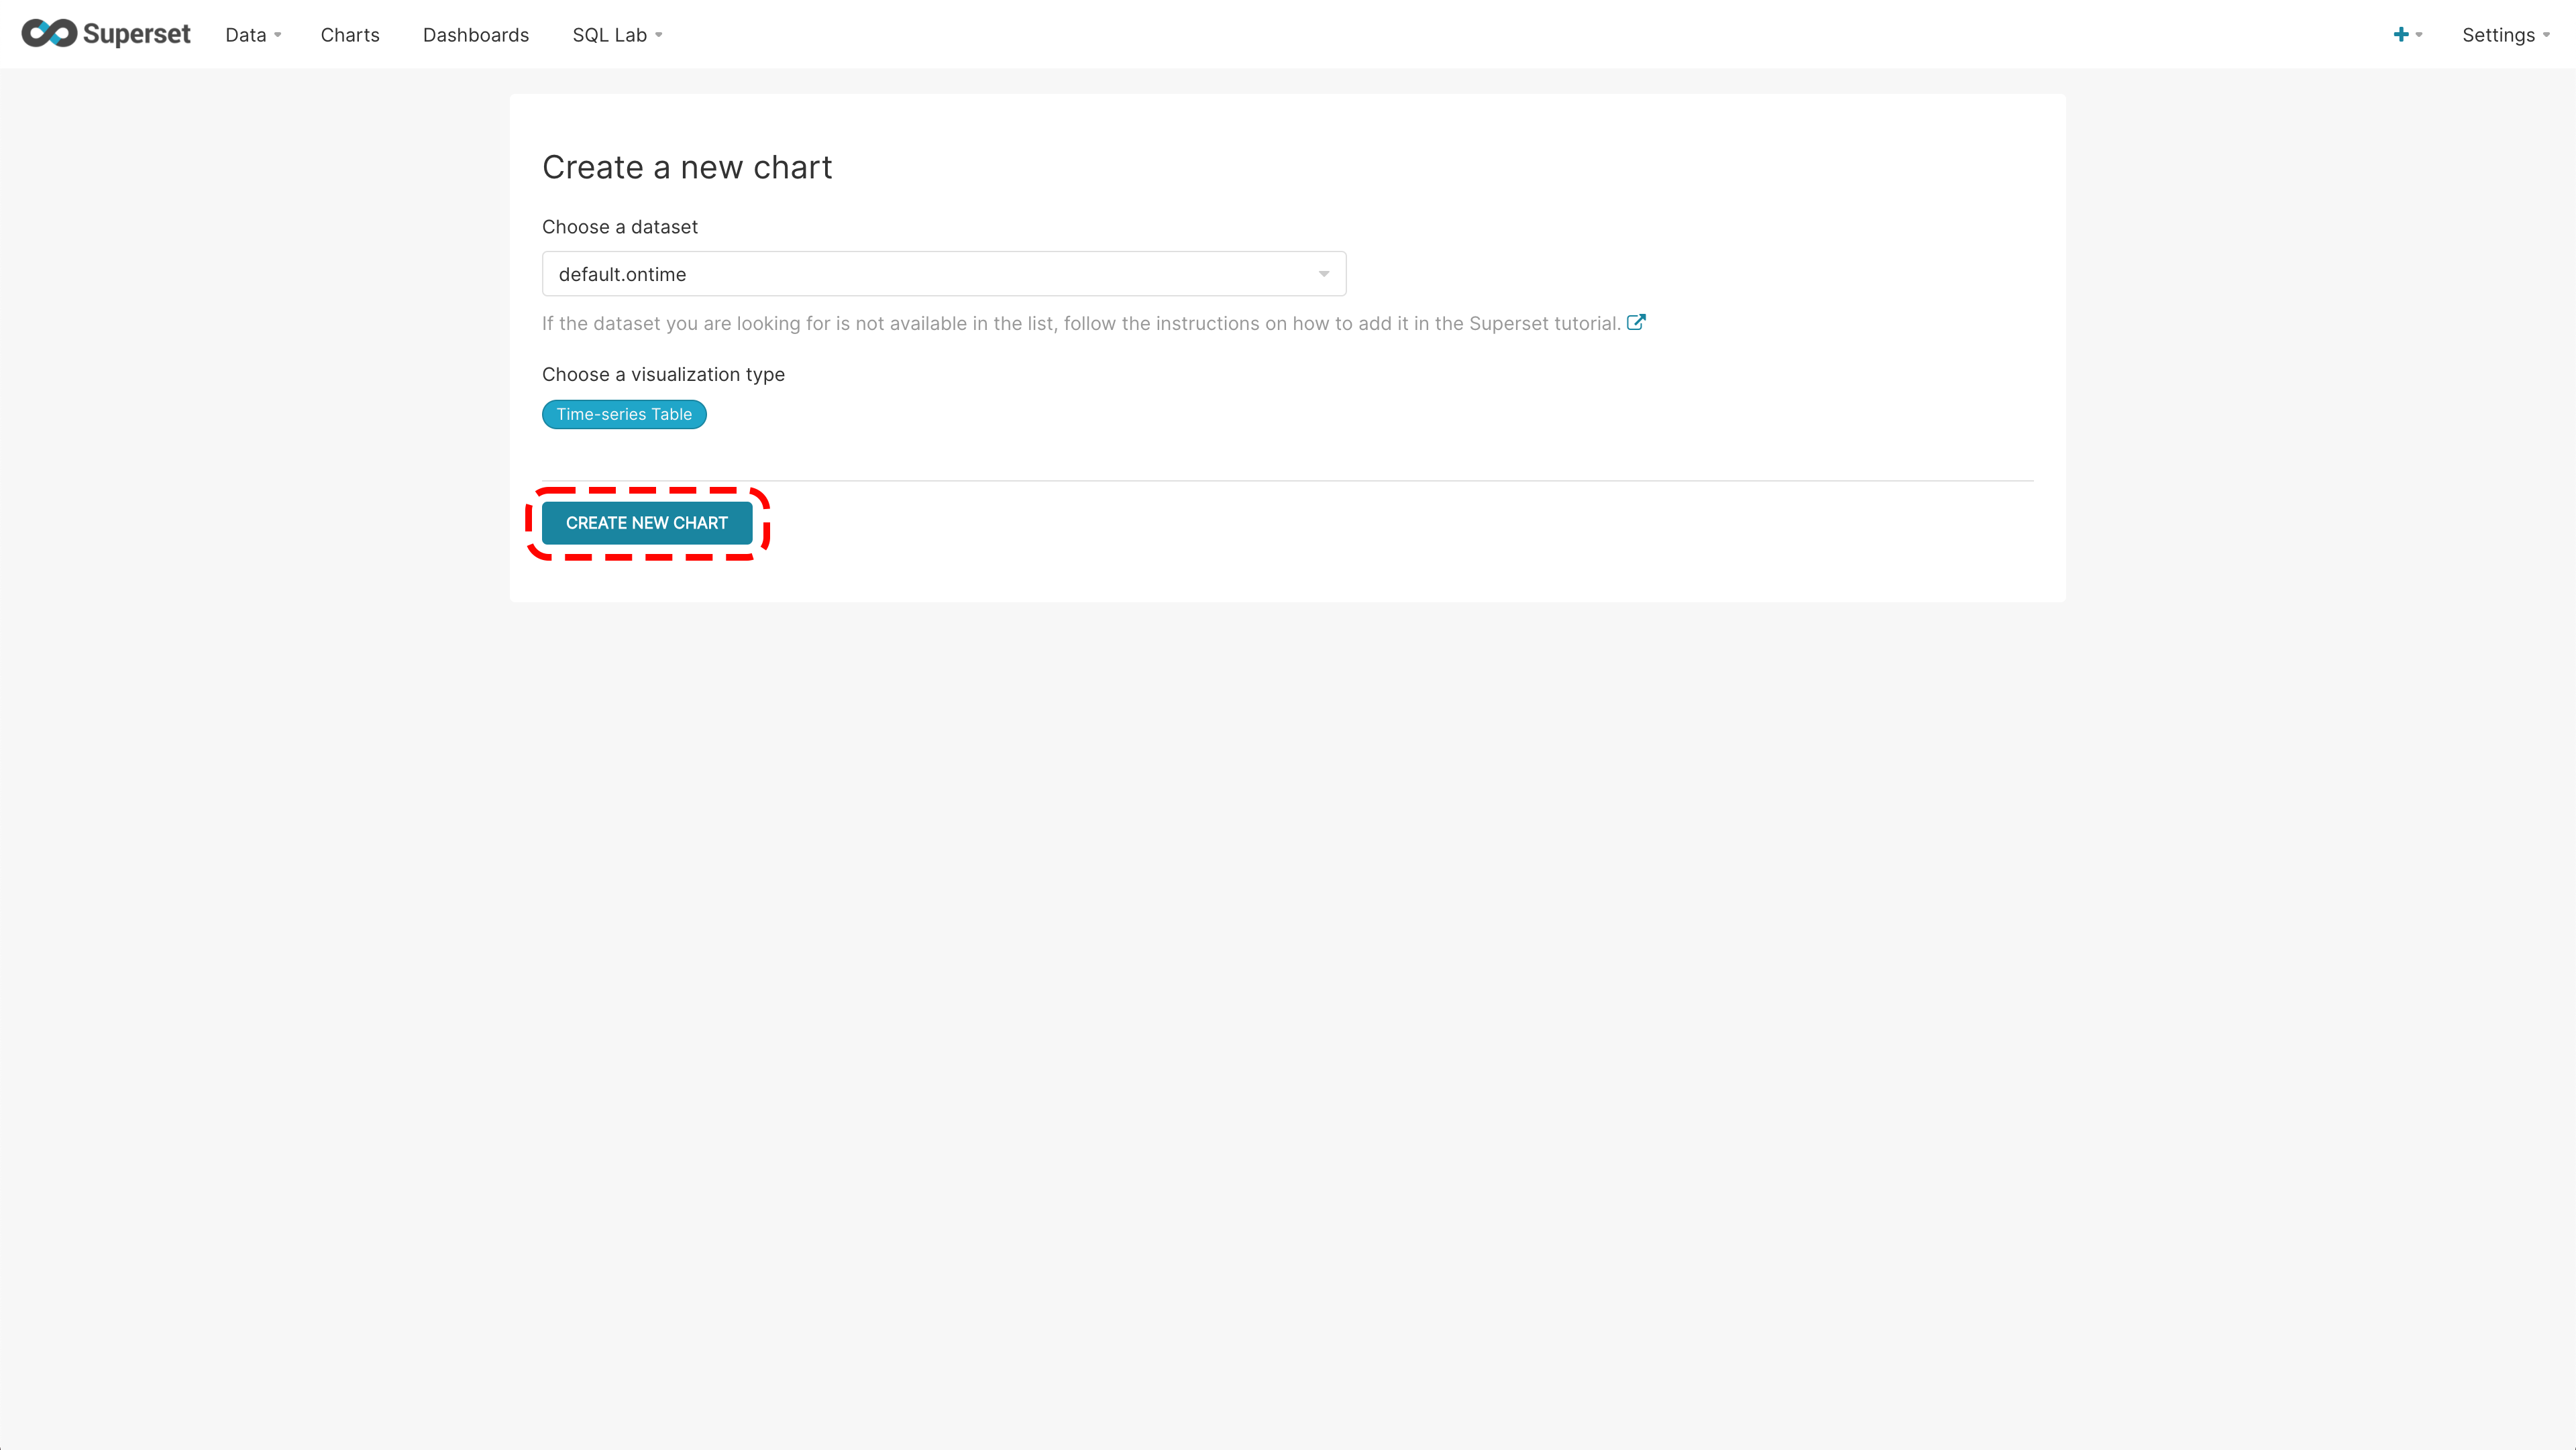
Set the following:
- Dataset: Select the dataset to be used. In this case, a dataset tied to a specific table.
- Visualization Type: Select the chart type, such as line chart, time series, etc.
-
When ready, select Create New Chart.
-
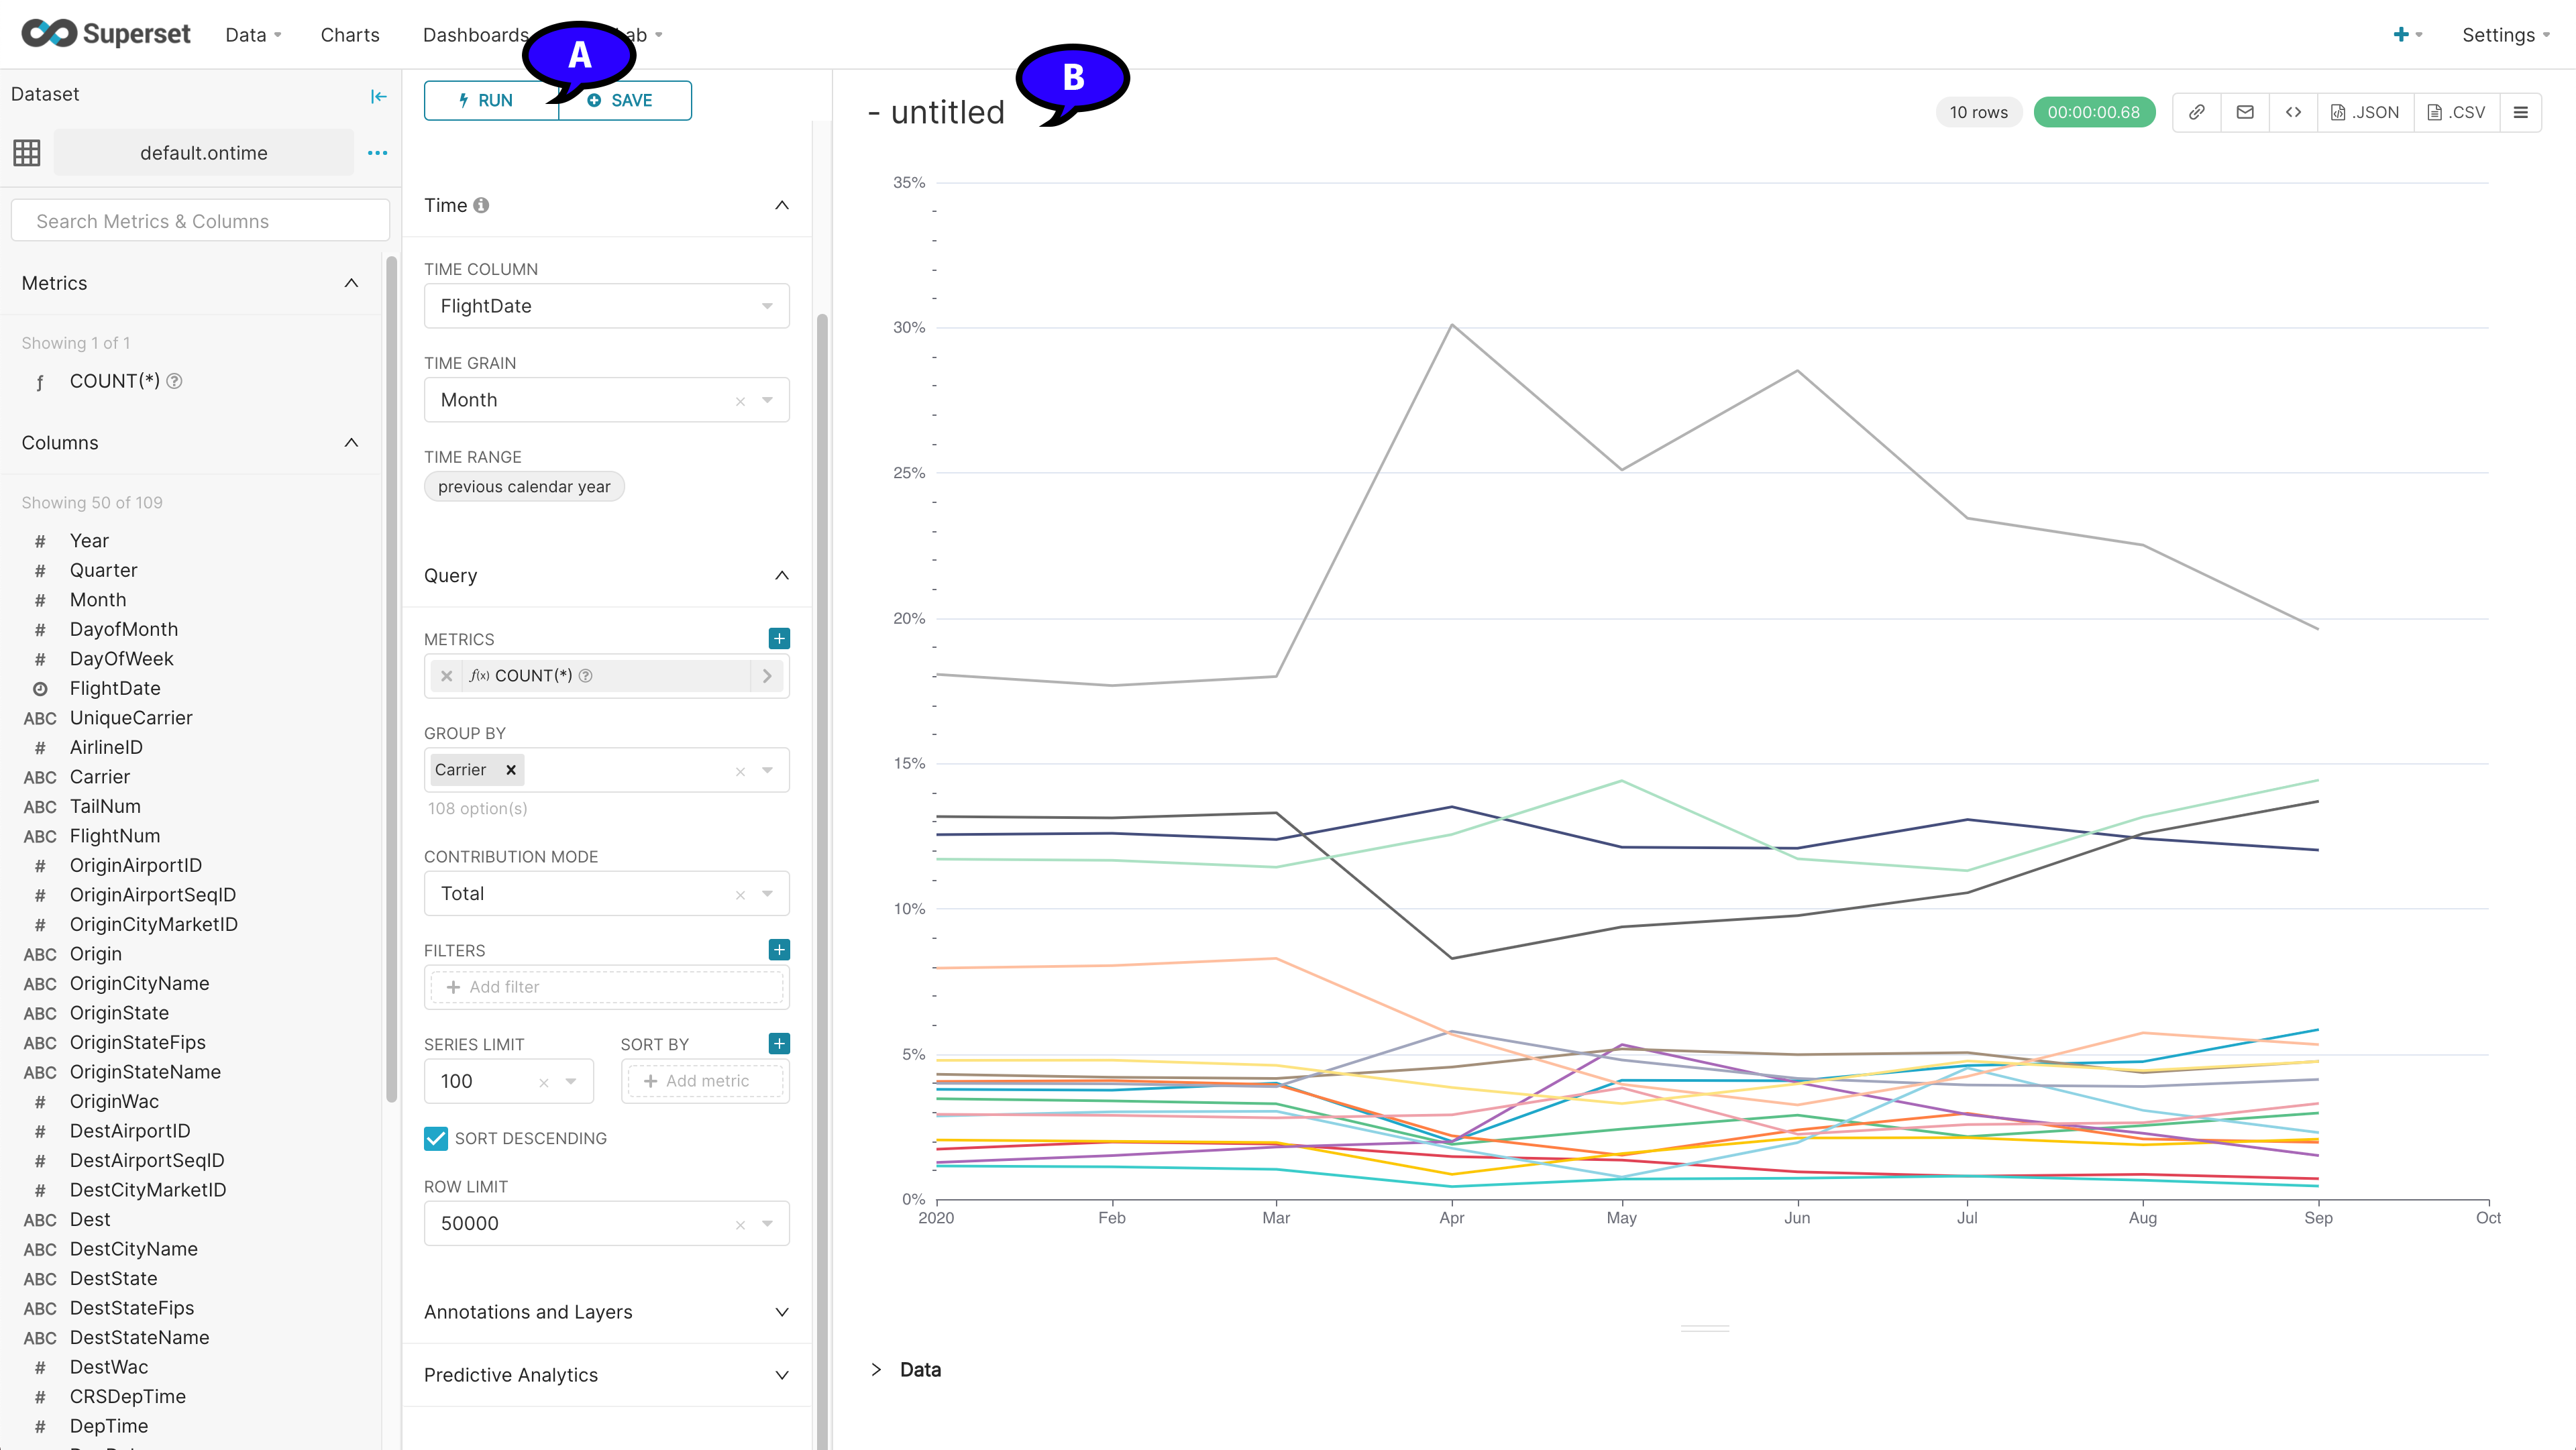
Depending on the chart created, the following options may be set to improve the chart’s display:
- Group By: Select a column to group data by. This is highly useful when dealing with multiple rows of the same unique source.
- Time Grain: Set the interval of time to measure when dealing with time series or similar charts.
- Time Range: Select the period of time of interest for the chart to cover.
-
After each setting change, select Run to view the updated chart (A).
-
Set the name by selecting the section above the chart, titled “- untitled” by default (B).
-
When finished, select + Save to save the chart.
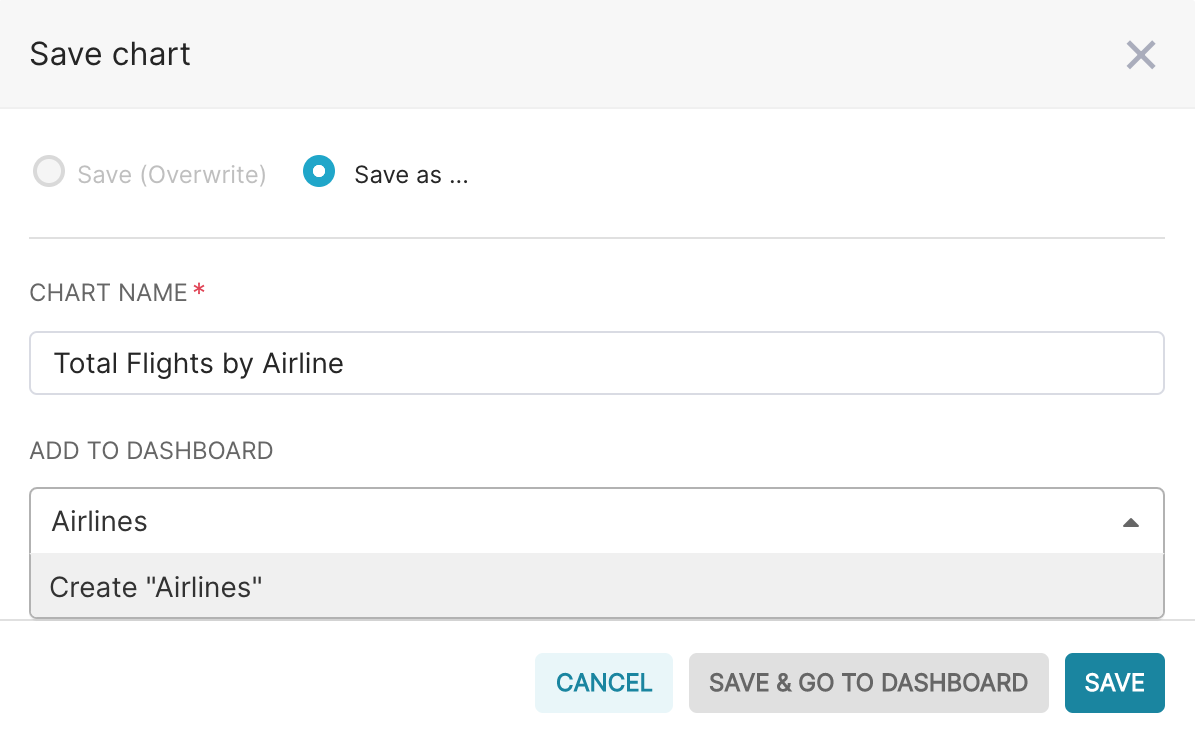
- Provide the chart name.
- Select a Dashboard to add the chart to, or enter a new Dashboard name and a title.
- Select Save when finished, or Save and Go To Dashboard to view the new chart.
Create a Chart from a Virtual Dataset
A Virtual Dataset is created from a query that is saved in the Superset SQL Labs. This allows for charts that are build from specific queries that include joins, specific filters, and other criteria.
Virtual Dataset Chart Prerequisites
Before adding a new chart in Superset from ClickHouse data, Superset must be connected to ClickHouse. See Connect Superset to ClickHouse for more information.
Create a Virtual Dataset Steps
To create a chart from a Virtual Dataset:
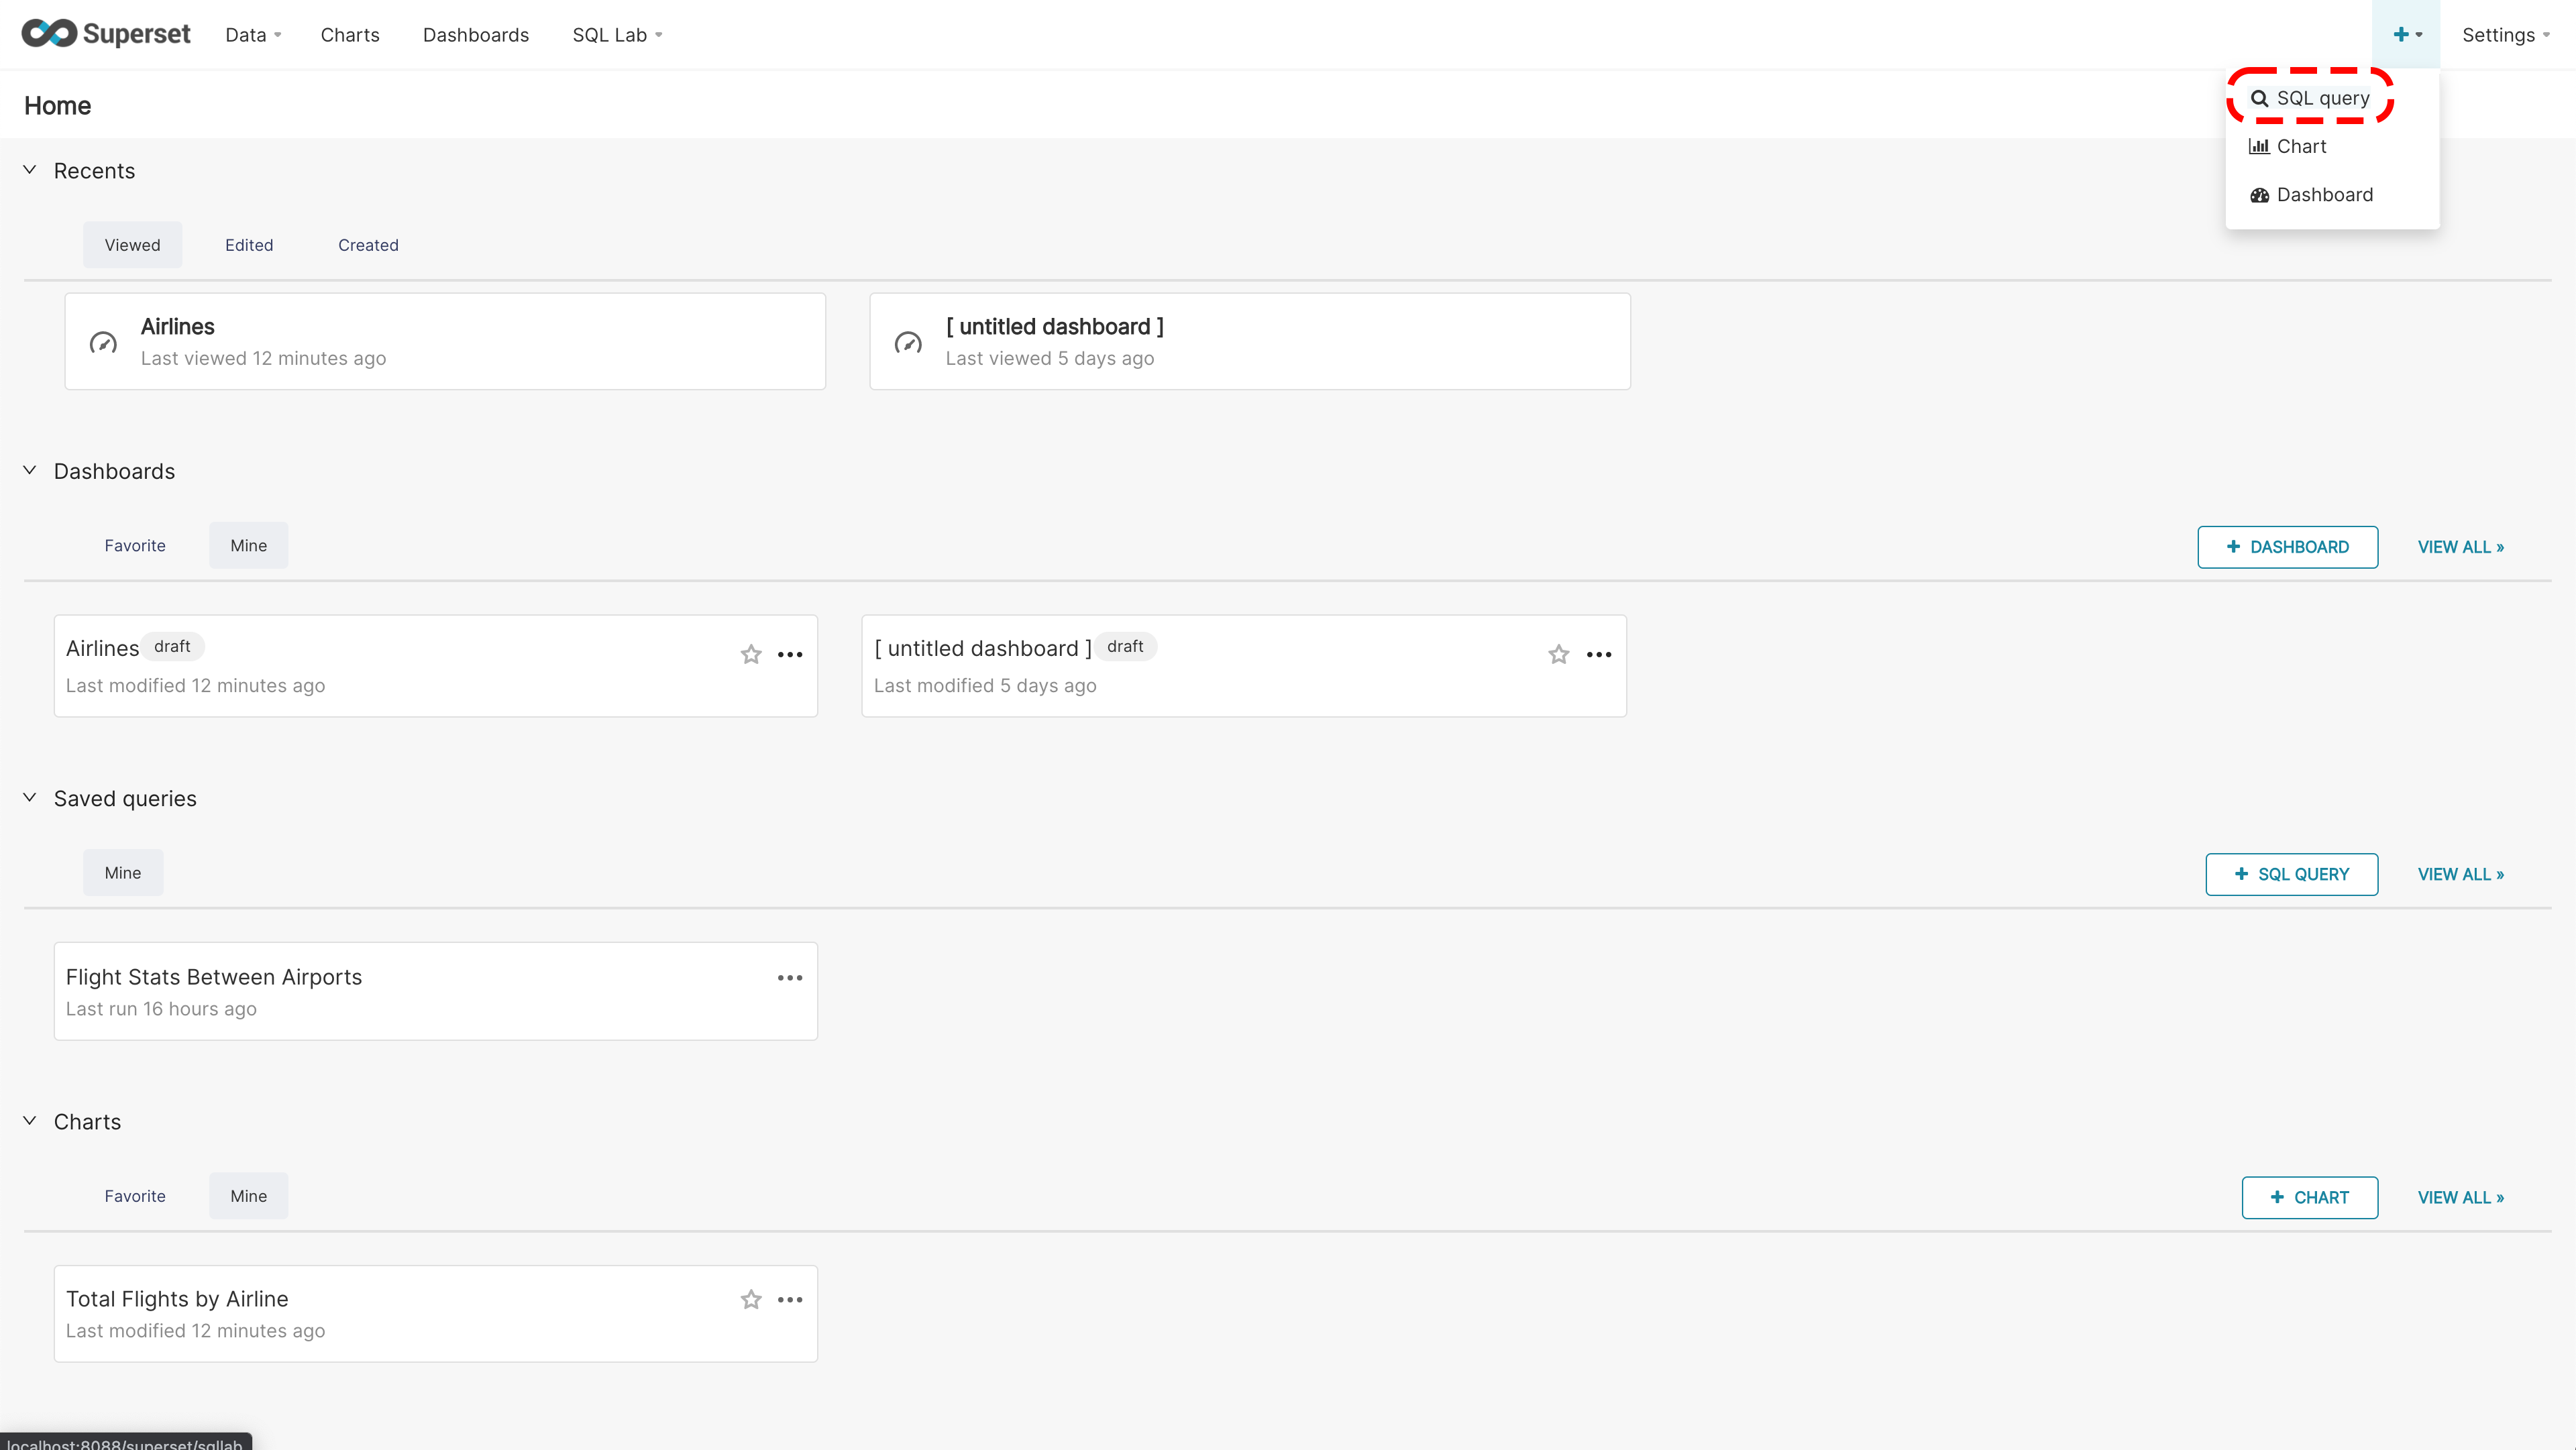
-
From the top menu, select + -> SQL Query.
-
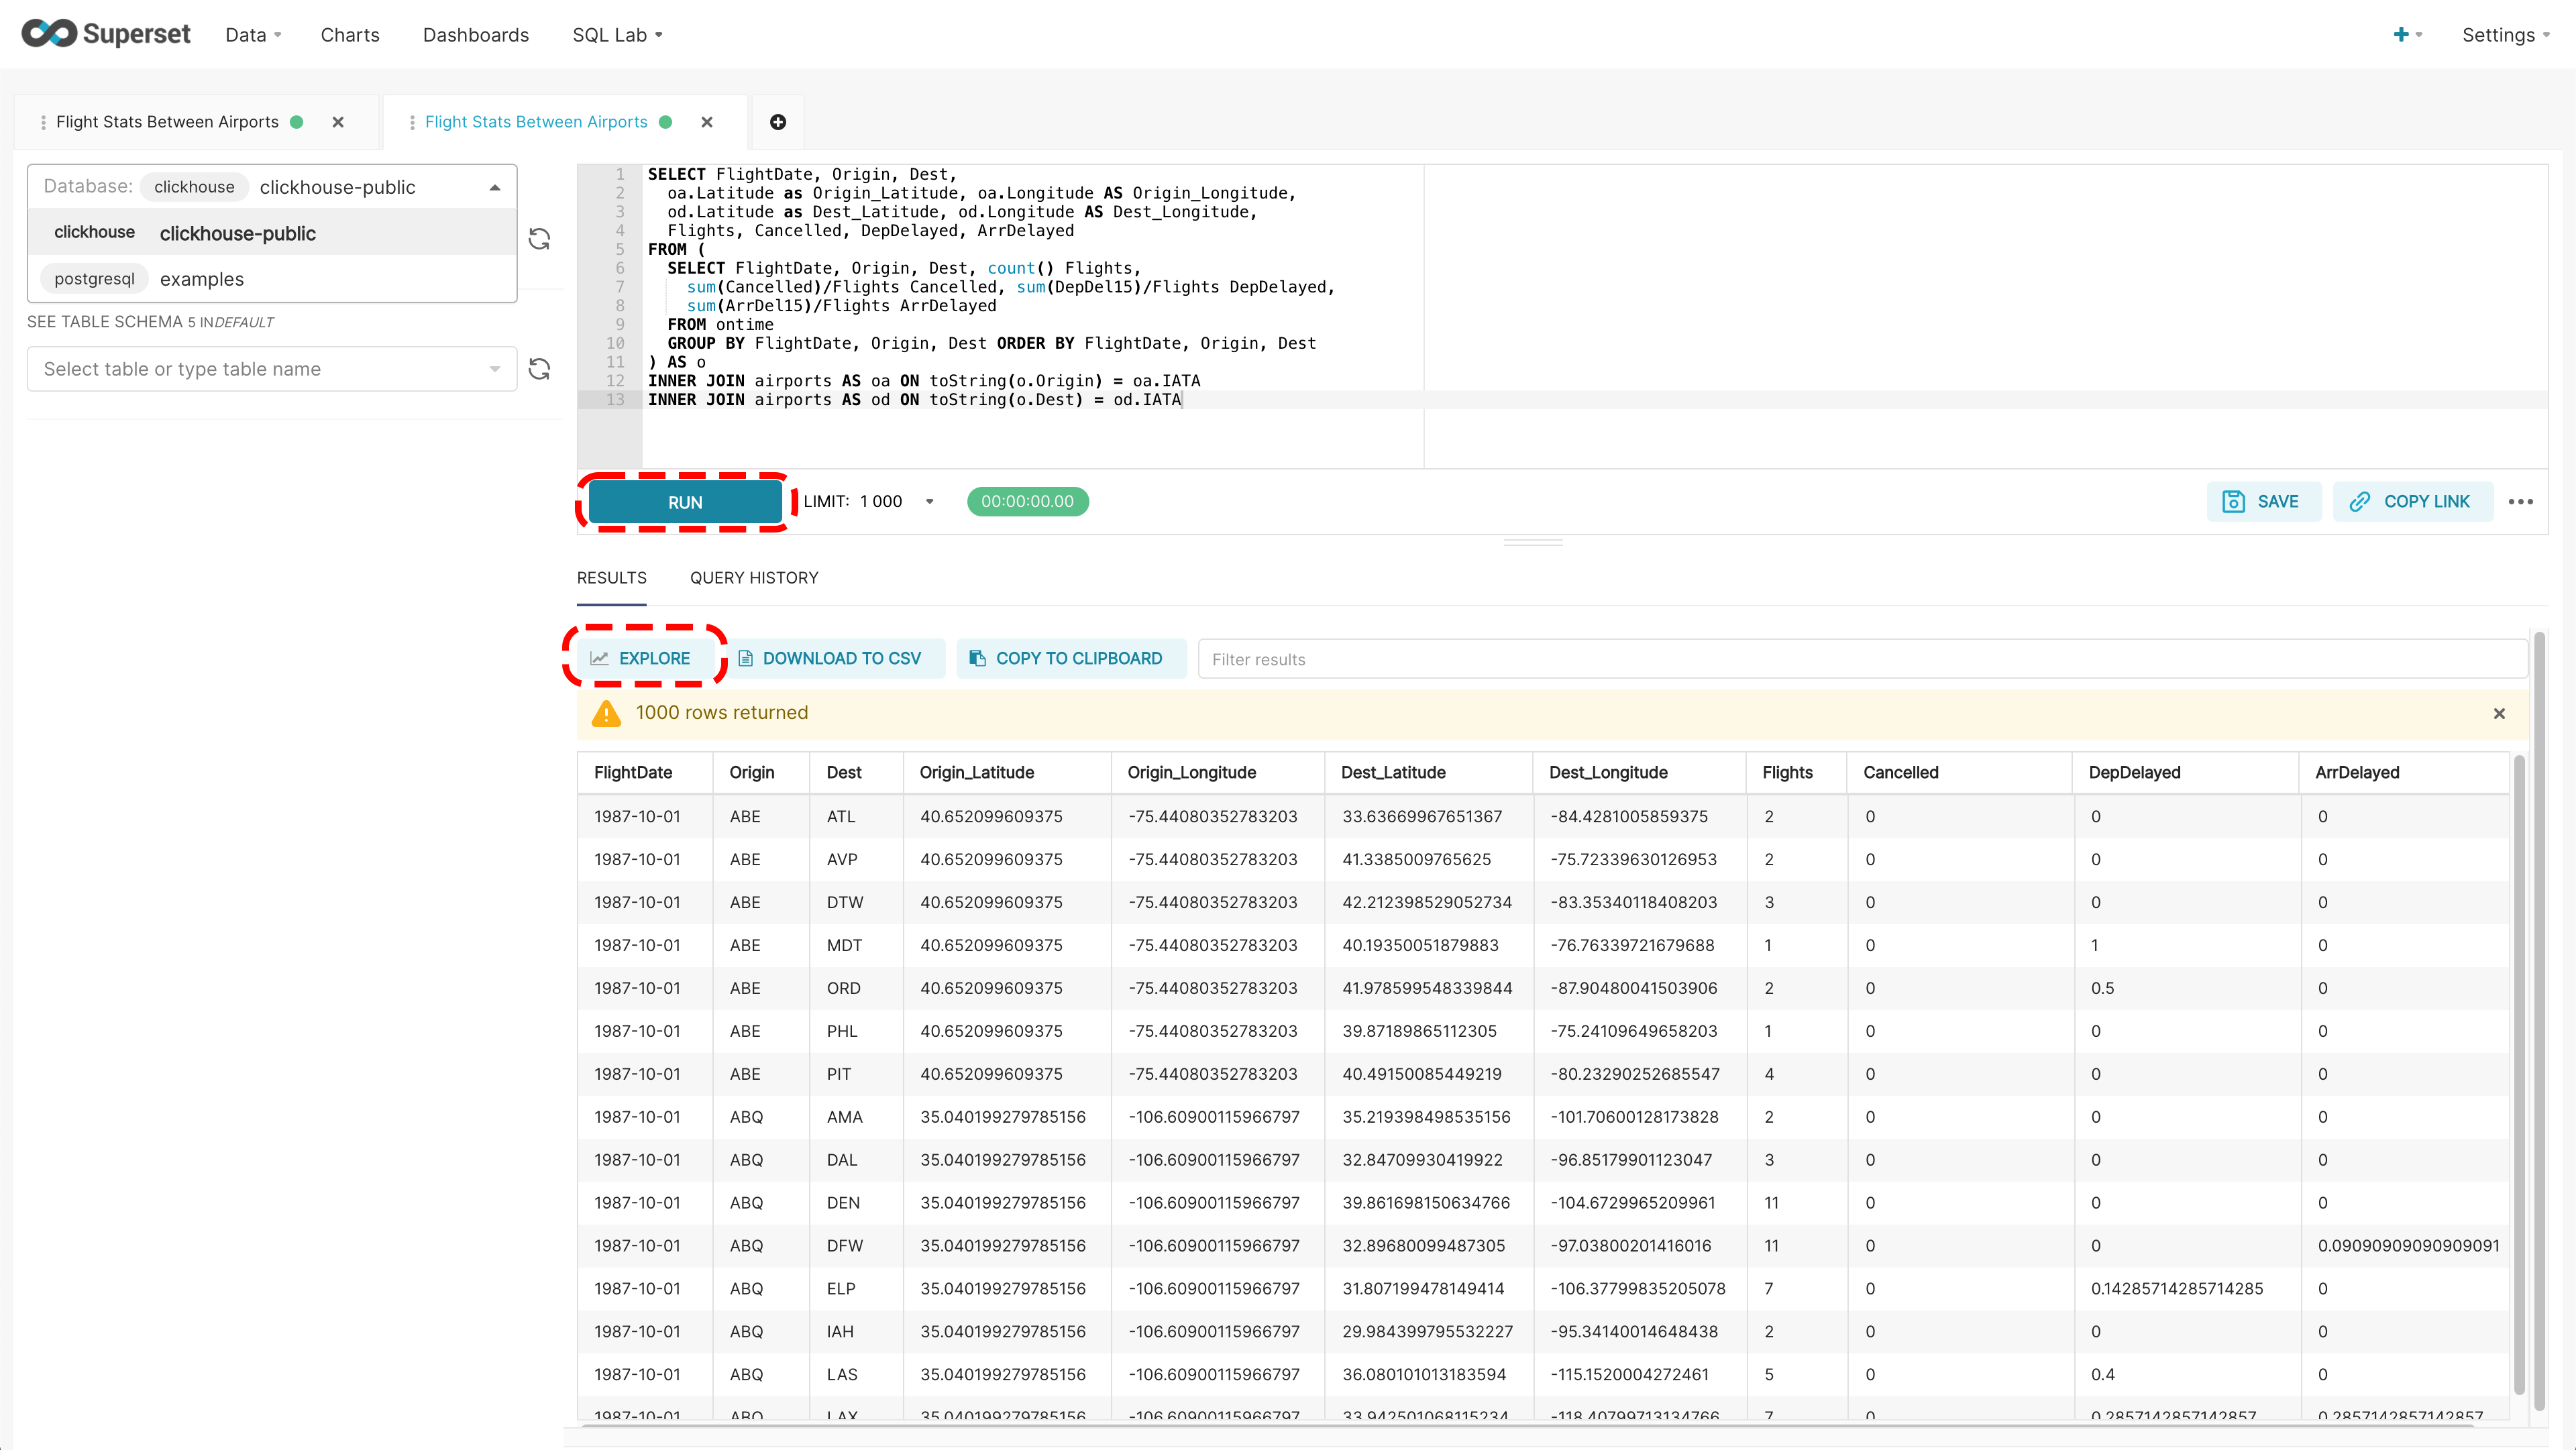
Enter the following:
- Database: Select the ClickHouse database connected to Superset.
- Schema: Typically this will be default.
- Table: Select a table or table type. If building from just the query, this can be left blank.
-
In the Query field, enter the ClickHouse SQL query to use. Select Run to verify the results.
-
Select Save or Save As to save the query into SQL Lab.
-
To save the query as a Virtual Dataset, select Explore.
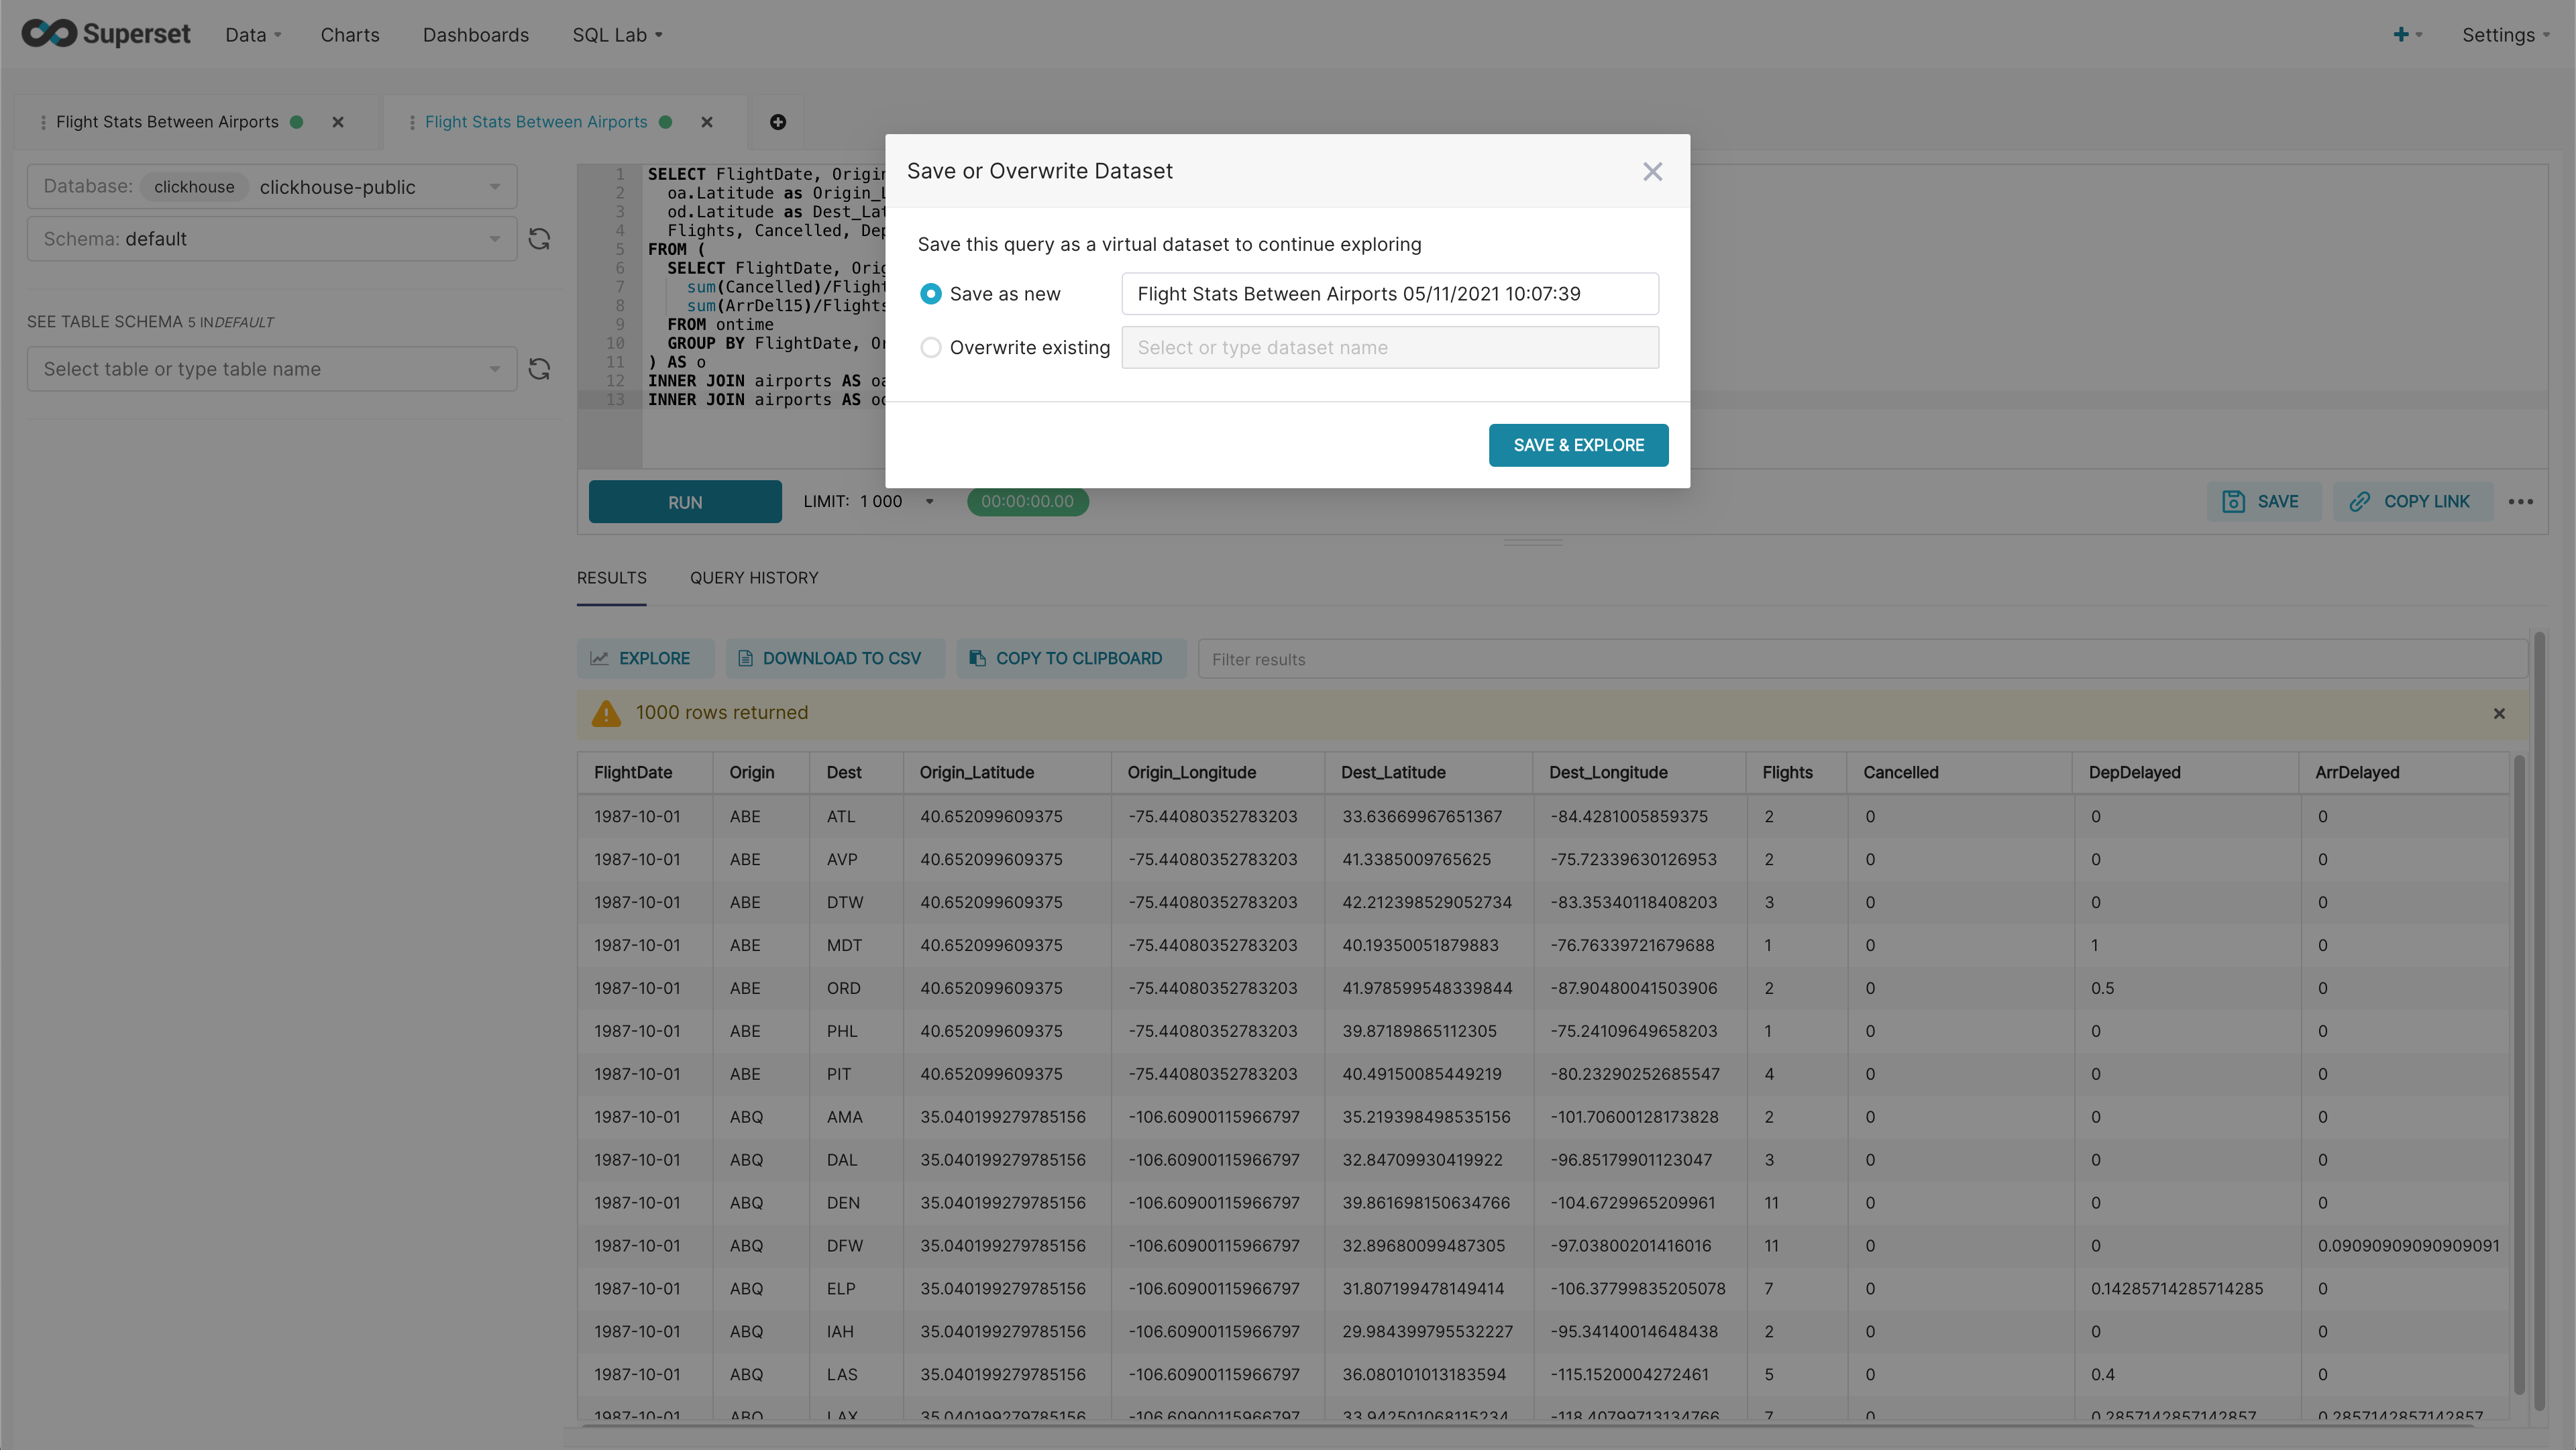
-
Set the name of the Virtual Dataset, then select Save & Explore.
At this point, a Chart can be created from the Virtual Dataset. See the section Create Chart from an Existing Virtual Dataset Steps for information on setting up the chart.
Create Chart from an Existing Virtual Dataset Steps
To create a chart from an existing Virtual Dataset:
-
Either create a new chart by either:
- Selecting Charts -> +Charts, then selecting the Physical Dataset tied to the Virtual Dataset, and Visualization Type to use.
- Or from creating a Virtual Dataset as detailed in the process Create a Virtual Dataset Steps.
-
To change the Virtual Dataset to use, select the … in the upper right under the Dataset heading, then select Change Dataset.
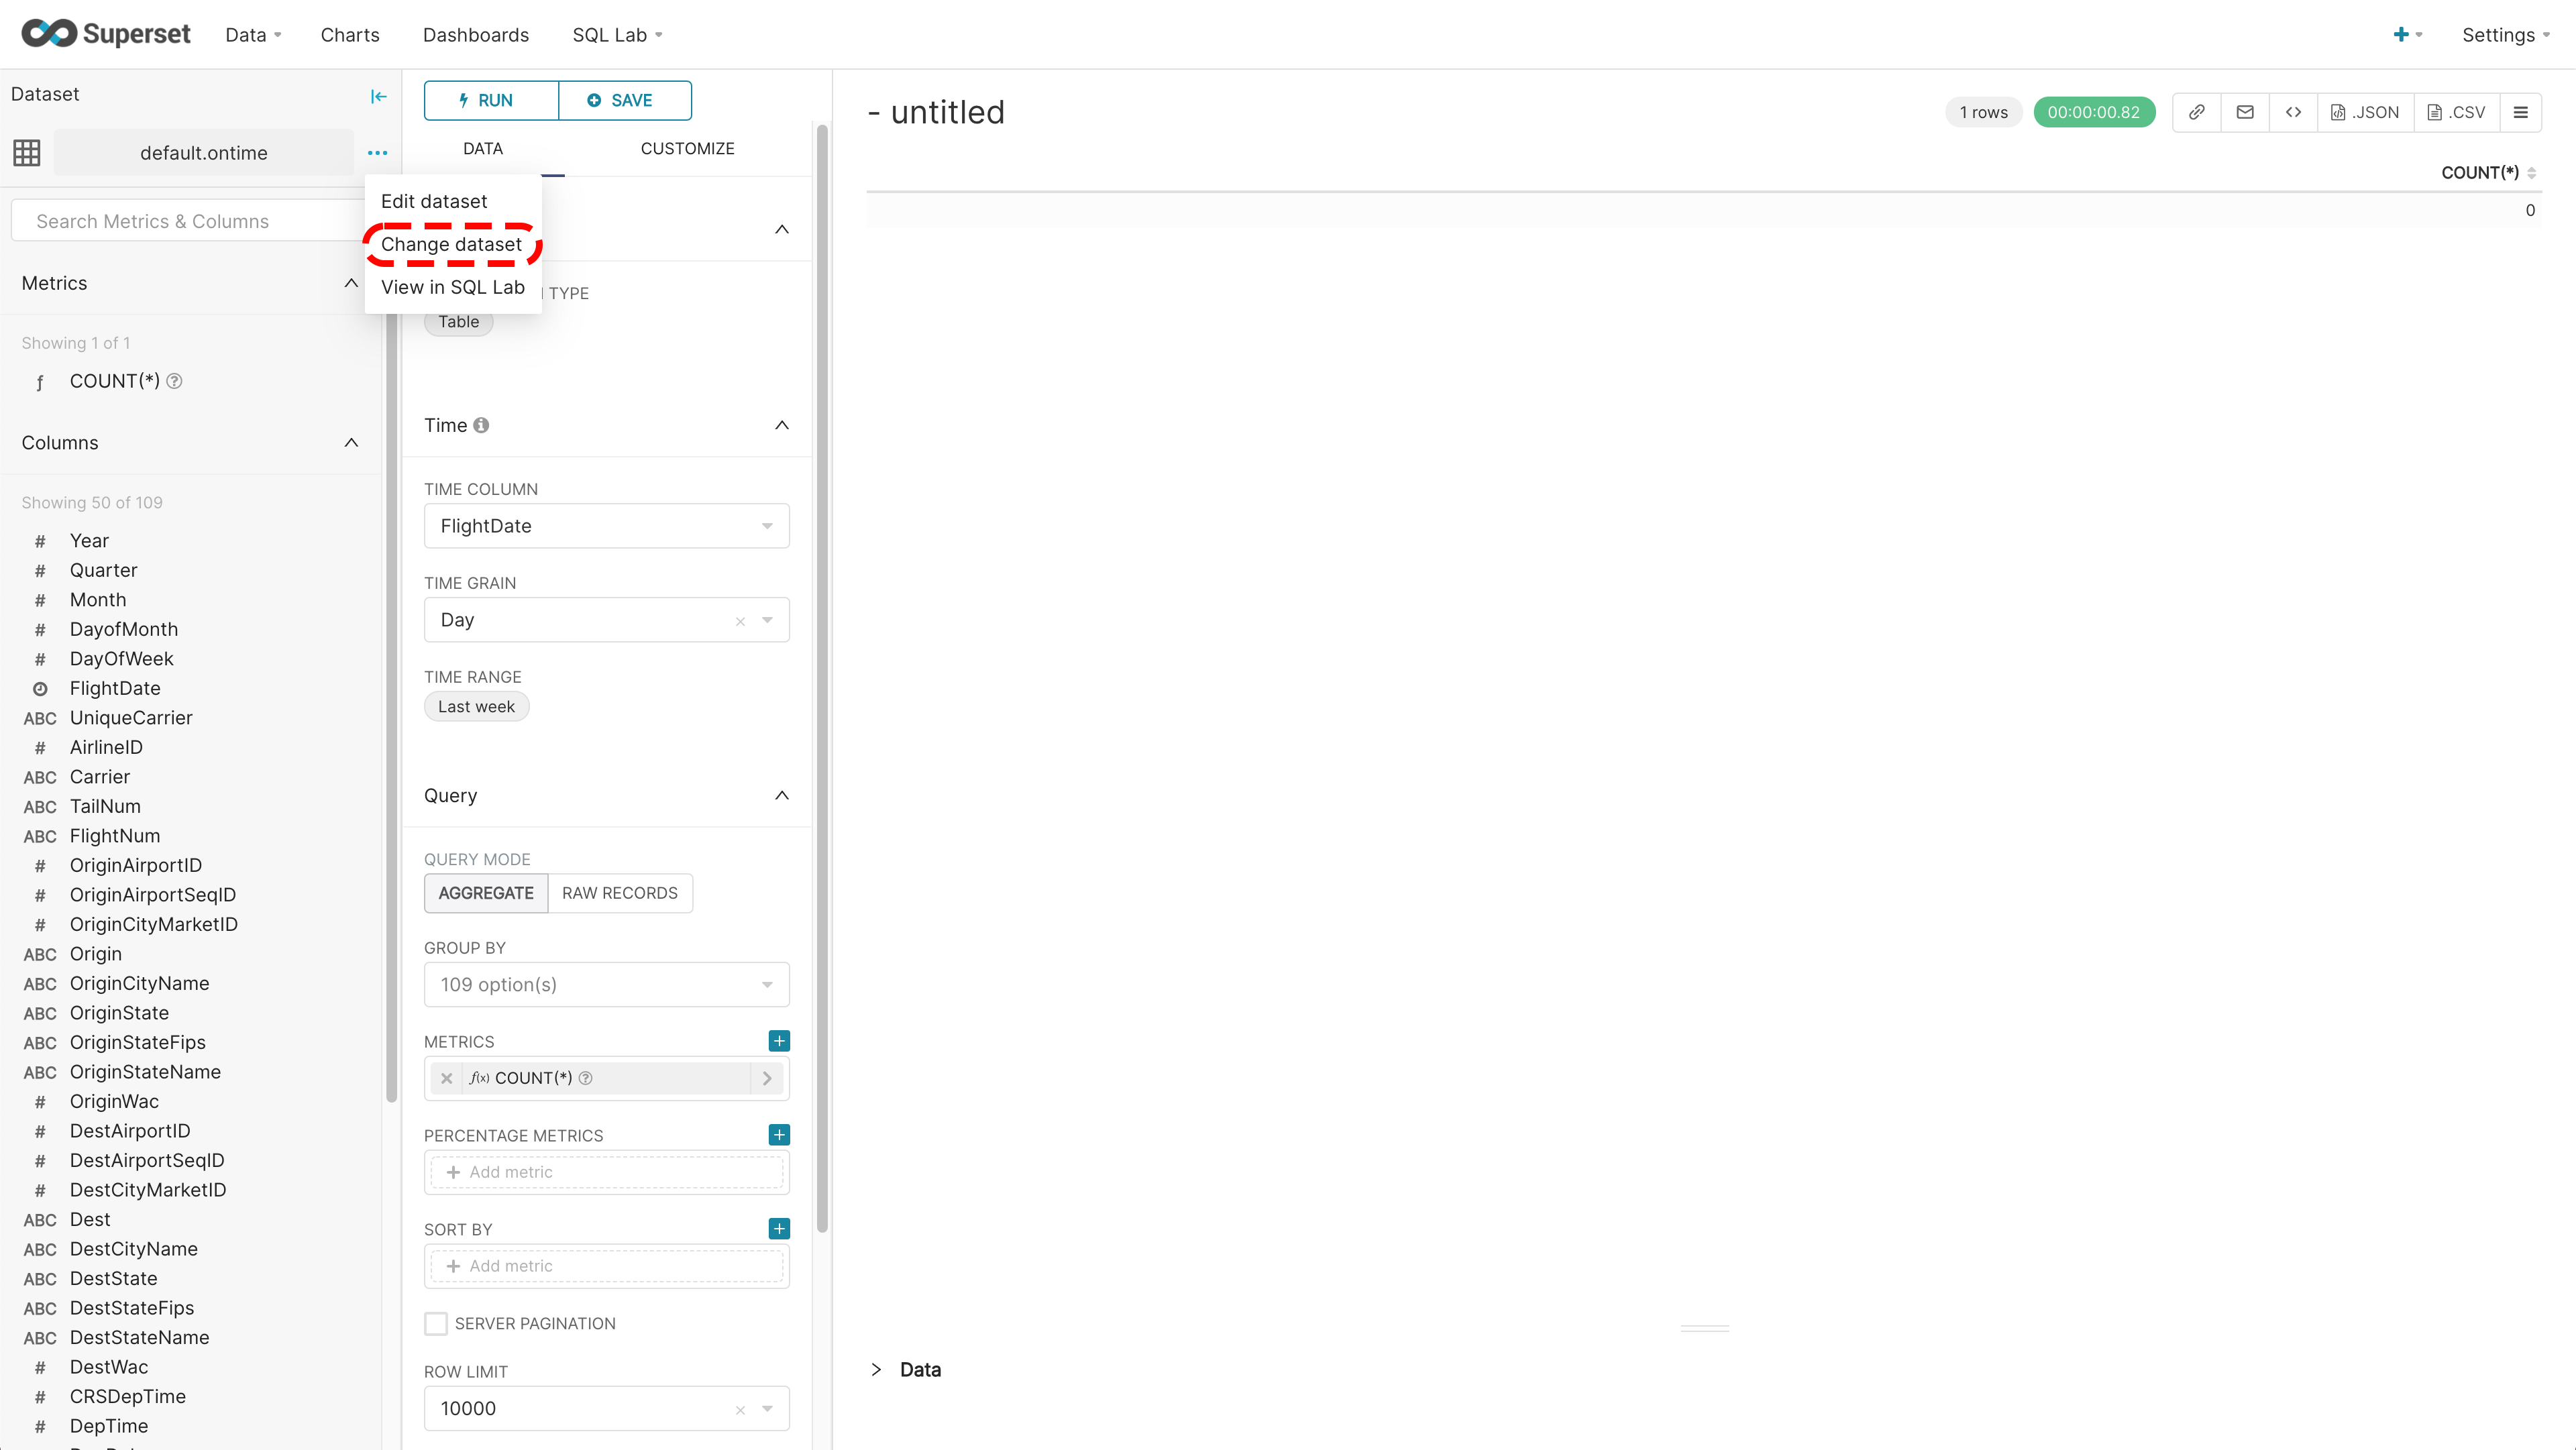
- Select the Virtual Dataset to use, then click Proceed to acknowledge that changing the chart’s dataset may break the chart.
-
Set the following required options:
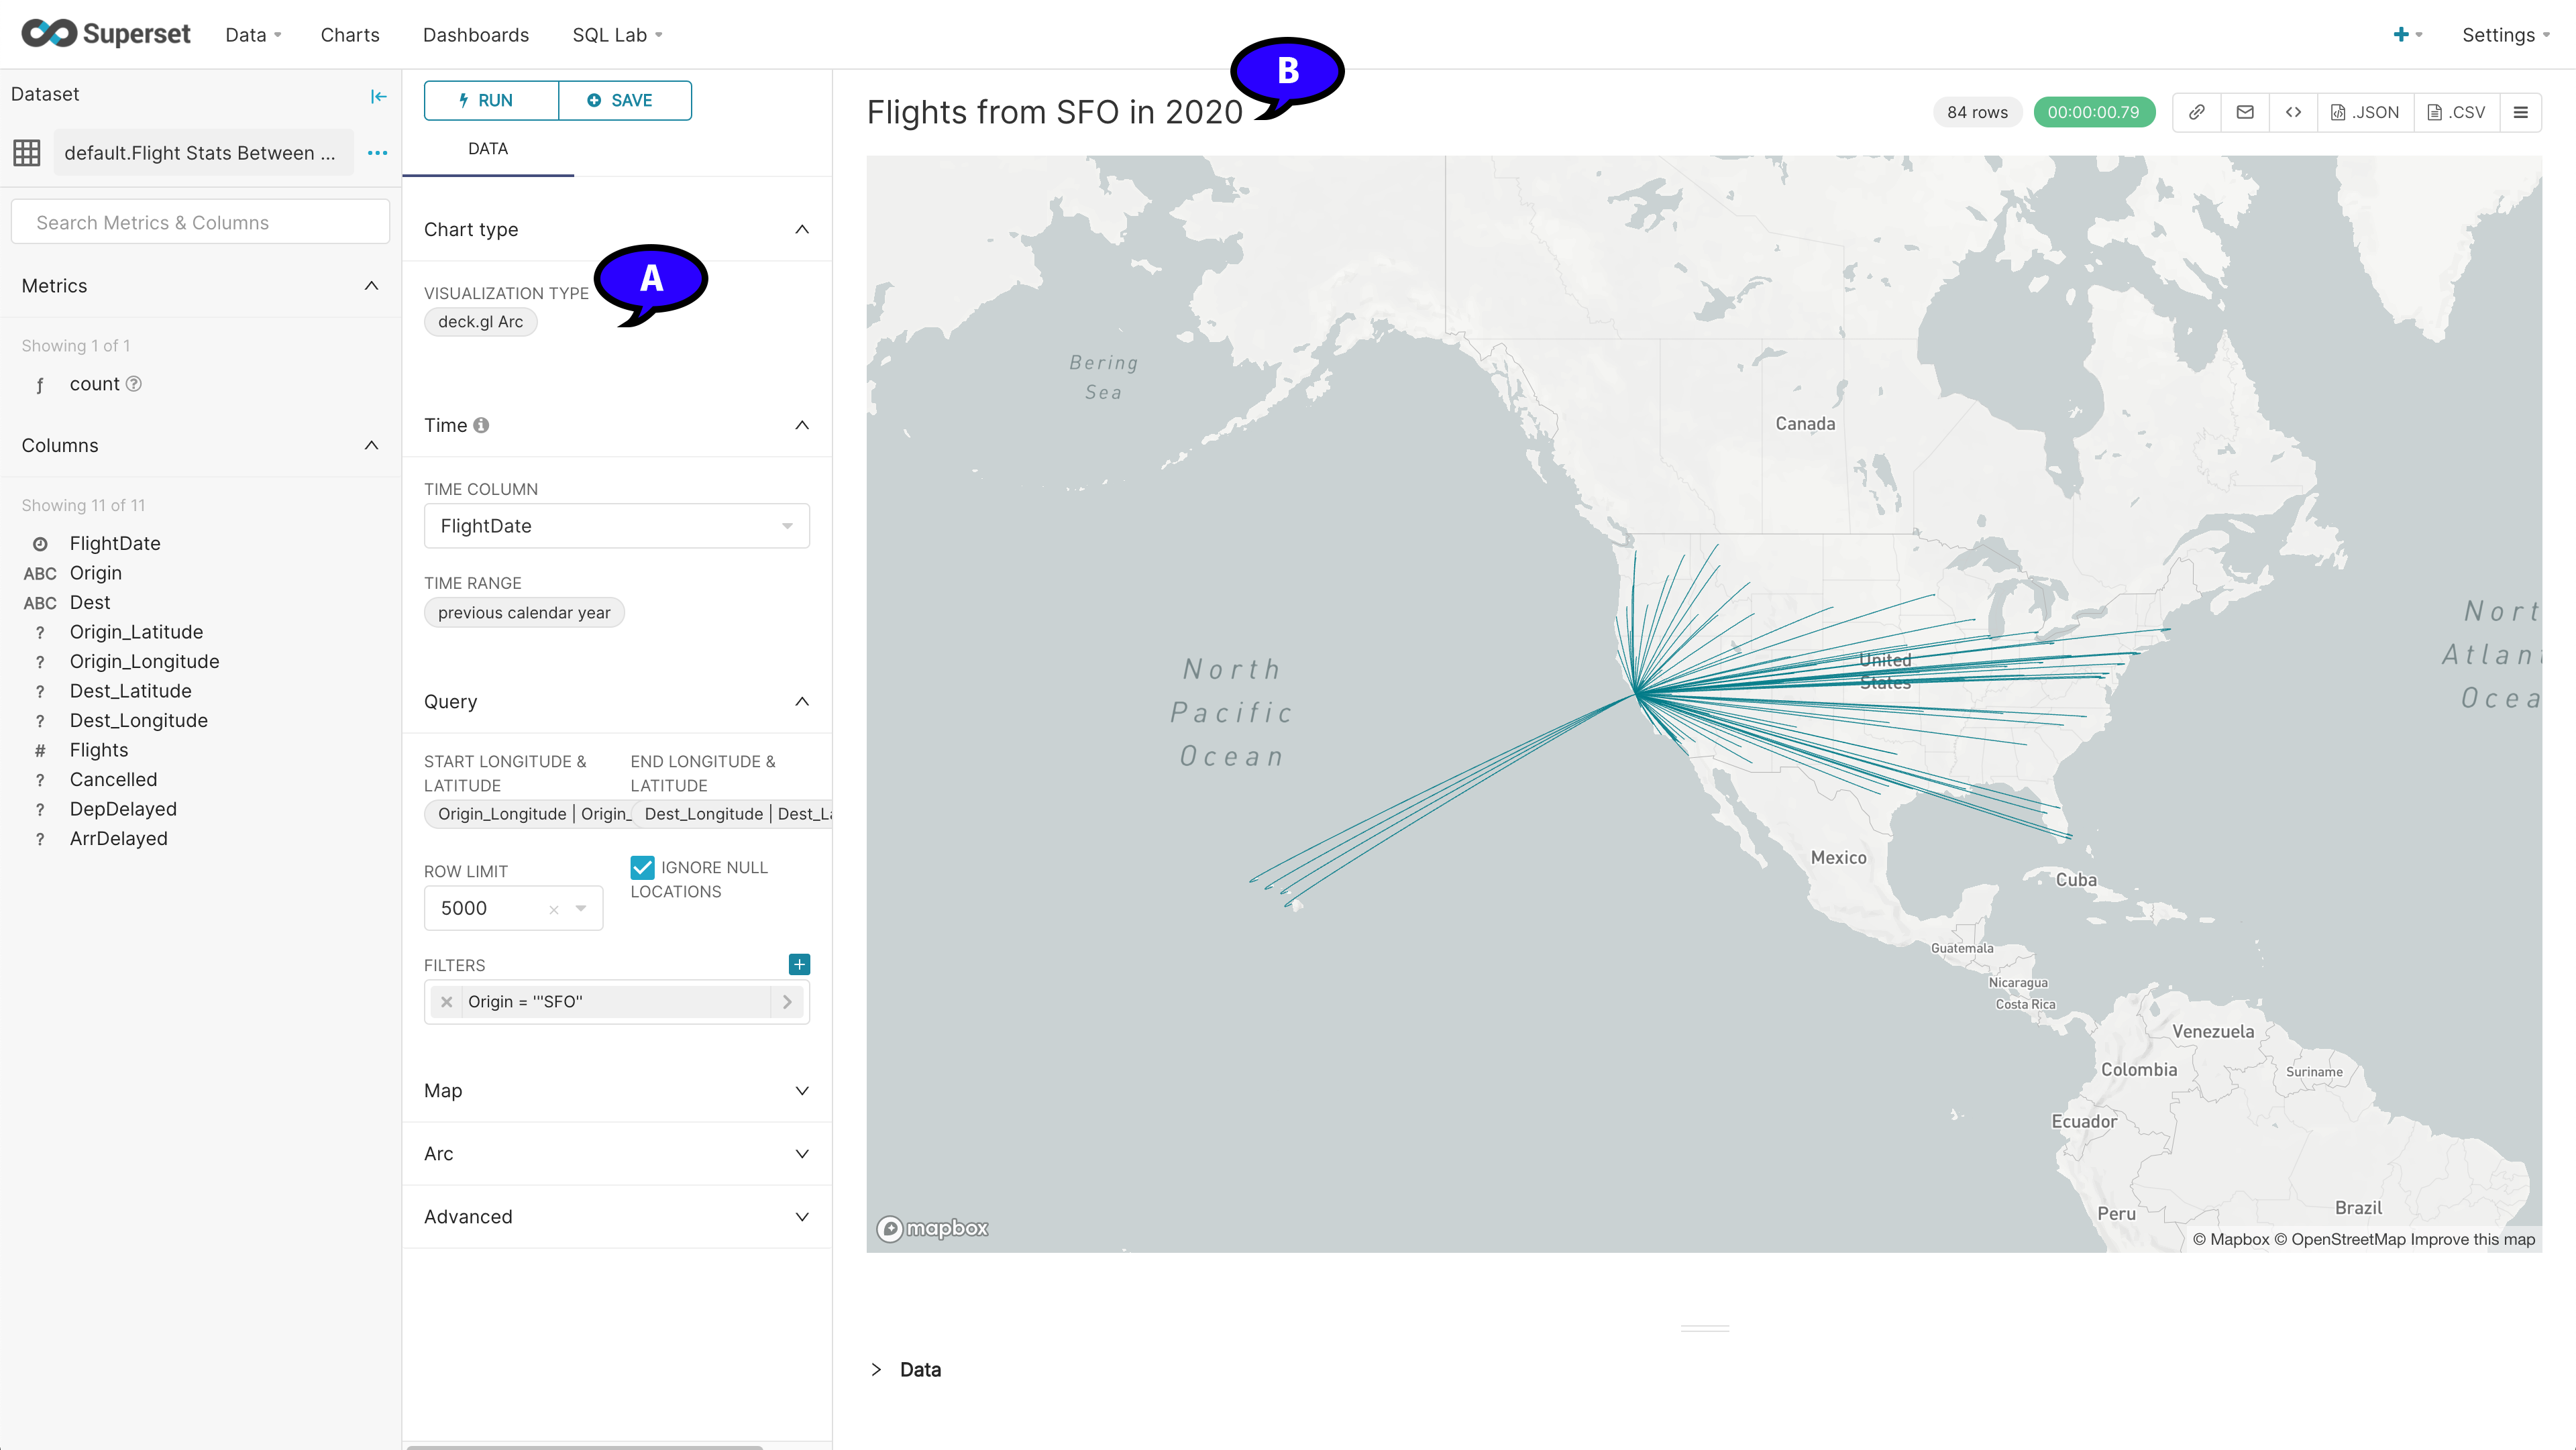
- Visualization Type: How the data will be displayed in the chart (A).
- Name: This is above the chart. Select it once, then set the name (B).
-
Depending on the Visualization Type selected, complete the other options.
-
When finished, select + Save to save the chart.
- Provide the chart name.
- Select a Dashboard to add the chart to, or enter a new Dashboard name and a title.
- Select Save when finished, or Save and Go To Dashboard to view the new chart.
Adding Charts FAQ
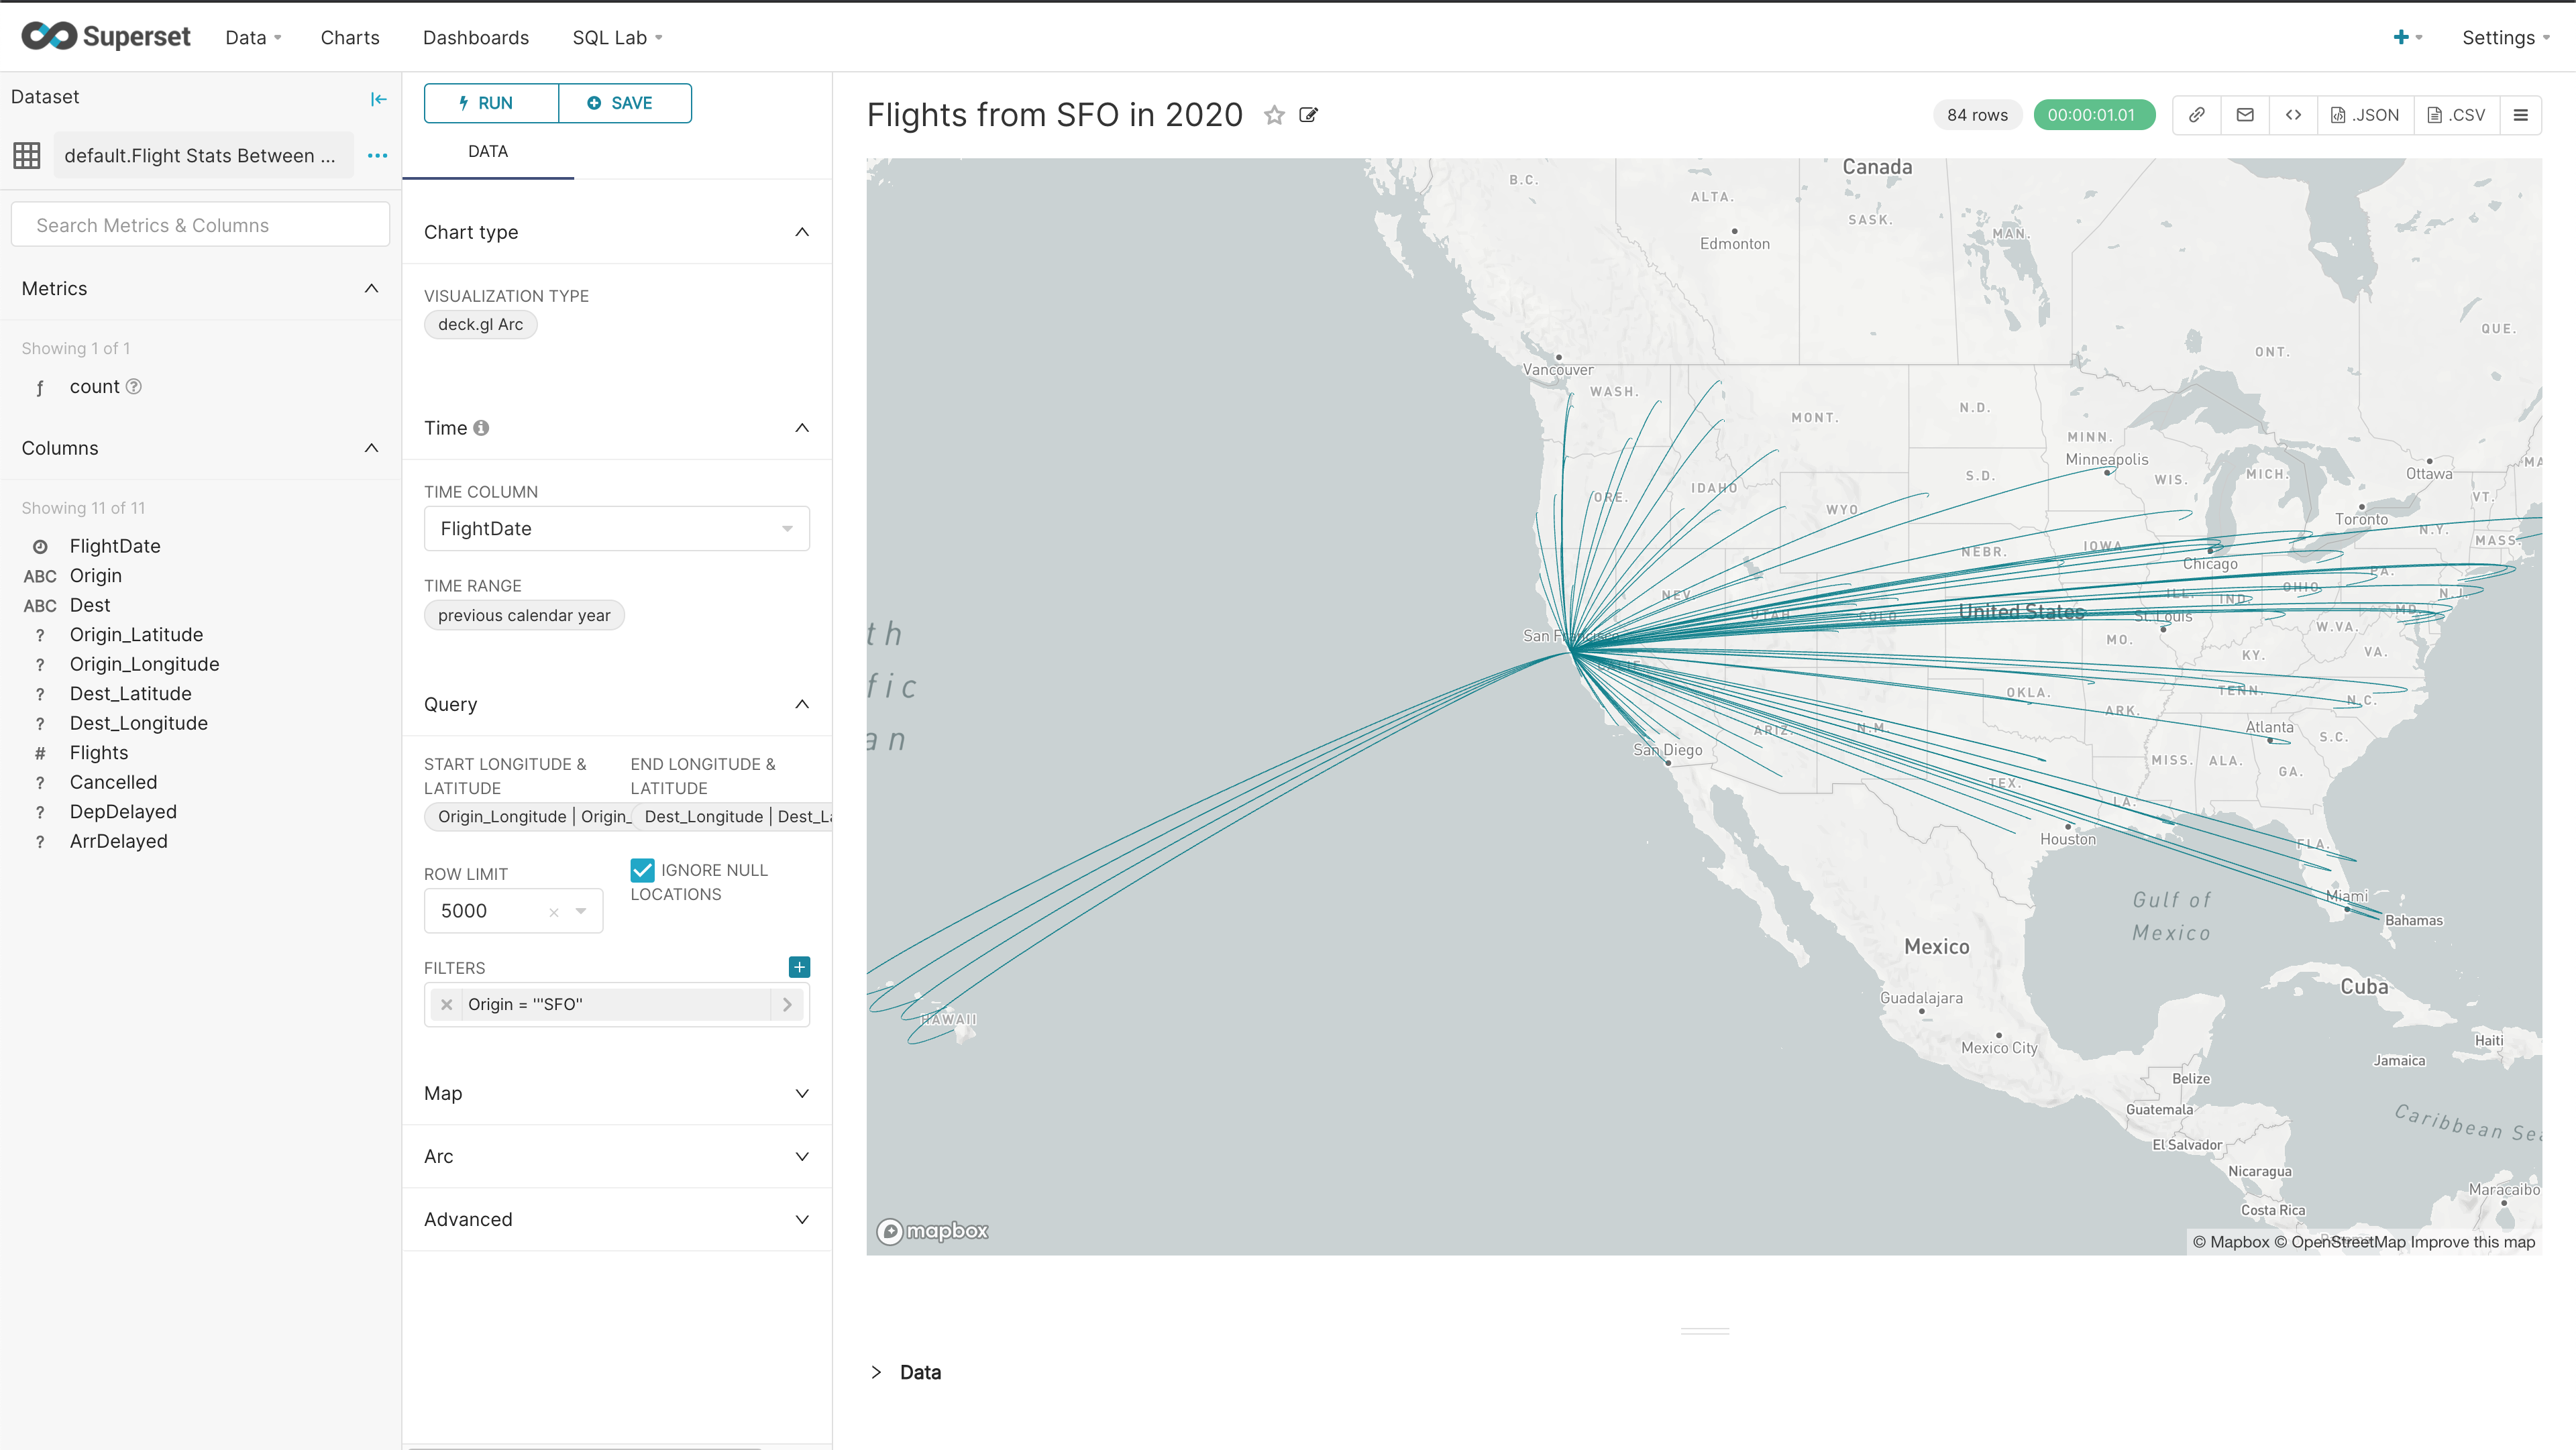
When I Add a Deck.gl Chart, I Get the Message ‘No Token Warning’. How do I fix it?
The NO_TOKEN_WARNING when using charts such as deck.gl Arc occurs when there is no API token to a map service for generating the map used with the geographic data. In this example, the geographic information provides flight information, but there is no token for the mapbox service to retrieve the map data.
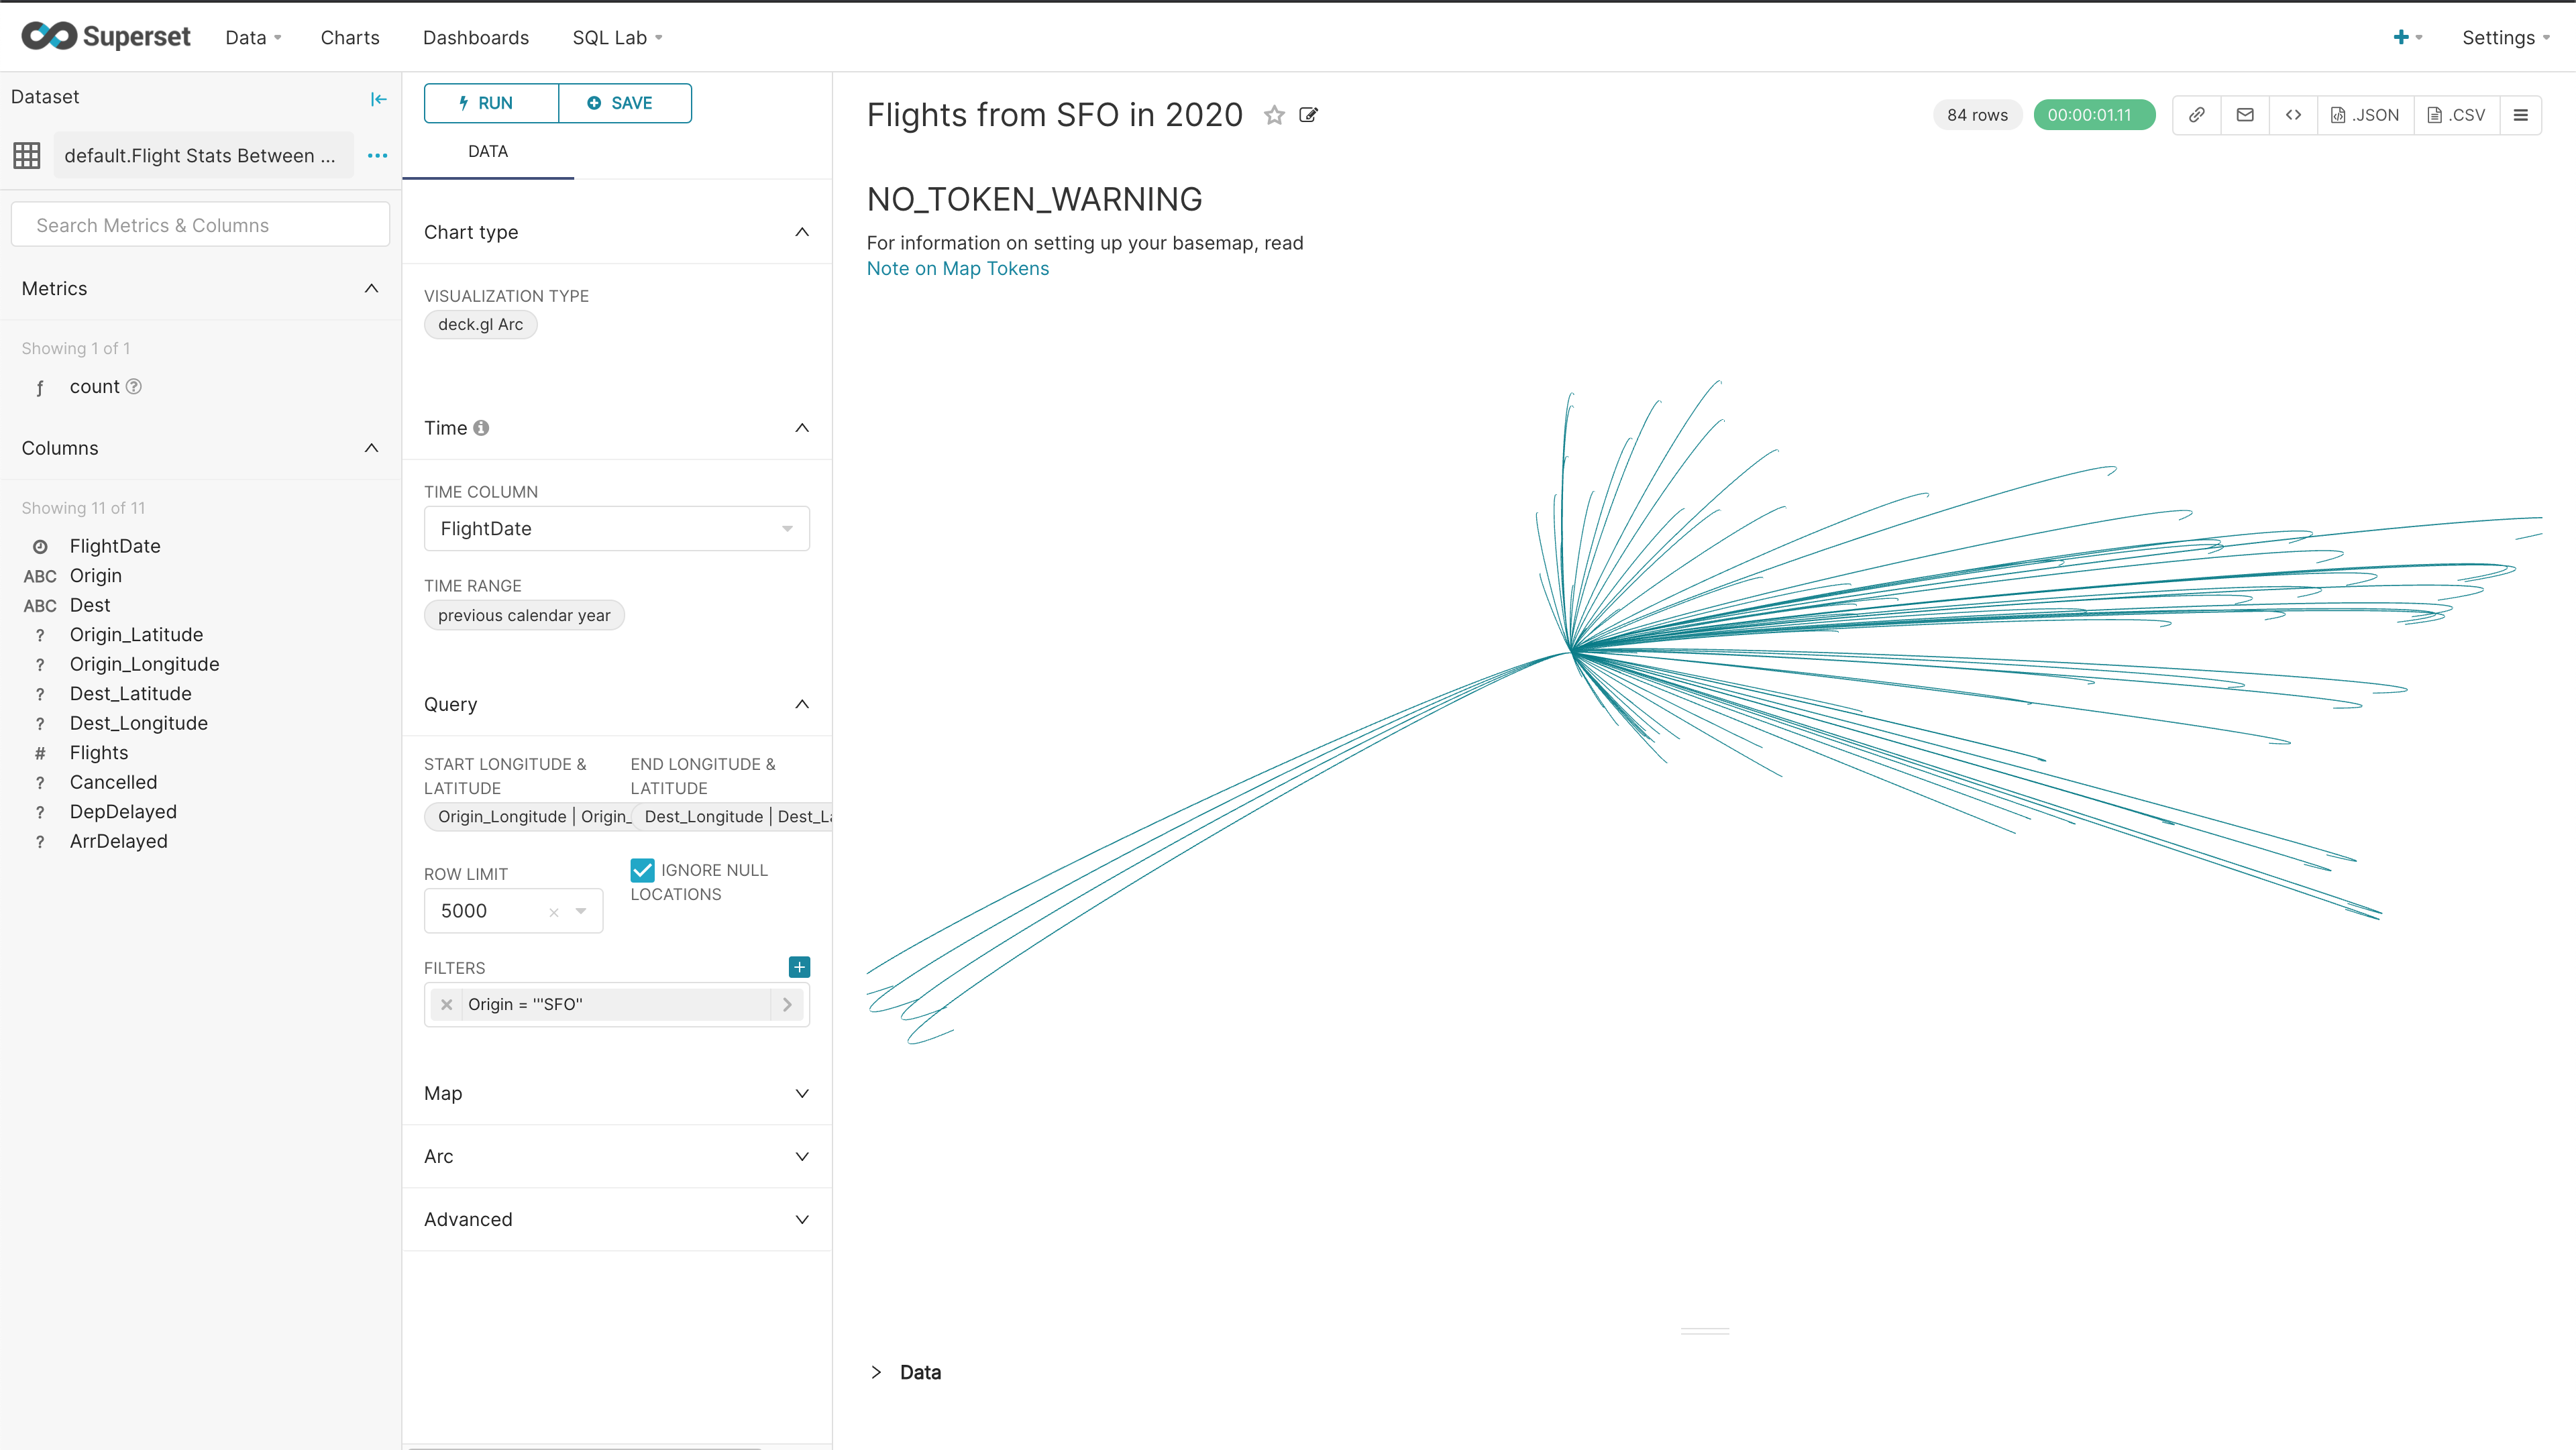
A token can be retrieved from mapbox after completing their registration process. After obtaining the token, place it in the file superset_config.py with the variable MAPBOX_API_KEY. For example:
MAPBOX_API_KEY = 'mytoken'
For Docker based installations, this is in the directory docker/pythonpath_dev. Once added, restart Superset: