Integrating Prometheus
Prometheus is a popular open-source library used for event monitoring and alerting. We’ll look at how to connect your Altinity.Cloud environment to a Prometheus server. There are two ways to do this:
- Send metrics to an external Prometheus server - Your environment will send metrics data to an external server.
- Allow an external Prometheus server to scrape metrics from your environment - The external server connects to your environment and retrieves metrics data from it.
We’ll also look how to explore the Prometheus metrics sent from your Altinity.Cloud environment.
Sending metrics to an external Prometheus server
As an example, we’ll look at setting up an external Prometheus server with Grafana Cloud. What we’ll do here can be done with a free Grafana Cloud account, although you can upgrade to a paid account easily.
Creating an external Prometheus server at Grafana Cloud
Log in to your Grafana Cloud account (if you don’t have one already, create a free one). Click the Grafana menu in the upper left corner, then select the Connections menu:

Figure 1 - The Connections menu
On the Add new connection page, enter hosted prometheus as the connection type. You’ll see the tile for Hosted Prometheus metrics:

Figure 2 - Select Hosted Prometheus metrics
Click the Hosted Prometheus metrics tile. On the Hosted Prometheus metrics page, select From my local Prometheus server in section 1:

Figure 3 - Choose a method for forwarding metrics
In section 2, select Send metrics from a single Prometheus instance:

Figure 4 - Send metrics from a single Prometheus instance
Next, create a token for the Prometheus server in section 3. First give your token a name; this example uses ch-to-prometheus-at-grafana:

Figure 5 - Defining a token name for the hosted Prometheus server
With the token name defined, click the  button. You’ll see something like this:

Figure 6 - Creating a token for the hosted Prometheus server
Grafana Cloud generates YAML that should go into the Prometheus configuration. Fortunately for us, the Altinity Cloud Manager (ACM) makes it easy to configure the connection between our Altinity.Cloud environment and the external Prometheus server. As you probably guessed, we need three values from the YAML snippet above: The url field and the username and password fields in the basic_auth section. The other value we need is the name of the Grafana data source for our new Prometheus server. That data source will be named grafana-[accountname]-prom. For our example, that’s grafana-dougtidwell-prom.
Now it’s time to configure our Altinity.Cloud environment.
Configuring an external Prometheus server for an Altinity.Cloud environment
To connect your environment to an external Prometheus server, go to the list of environments in the ACM and click the ![]() vertical dots icon and select Edit from the menu:
vertical dots icon and select Edit from the menu:

Figure 7 - The Edit Environment menu
In the Environment Configuration dialog, go to the Metrics tab and fill in the details of your external Prometheus server in the External Prometheus section:

Figure 8 - Configuring an external Prometheus server in the Metrics tab of the Environment Configuration dialog
Click OK to save the new configuration. Now the ACM will start sending metrics to your Prometheus server.
Our example here uses the Grafana Cloud Prometheus service, but the same procedure applies no matter what external Prometheus service your environment is using.
That’s one way to create a connection between your Altinity.Cloud environment and an external Prometheus server. We’ve told our environment to push metrics data elsewhere. The other way is to configure an external Prometheus server to pull metrics from our environment (scrape metrics is the Prometheus term). We’ll take a quick look at that before actually exploring our metrics data.
Allowing an external Prometheus server to scrape metrics from your environment
To let an external server scrape your ClickHouse® clusters for metrics, you need to give that external server access to your environment. Currently the best way to do this is to contact support, who can take you through the process.
- For AWS, the traditional approach is to define an VPC endpoint. See our documentation on setting up an Amazon VPC endpoint for the details.
- For GCP Private Service Connect, See our documentation on setting up Private Service Connect for the details.
Exploring Prometheus metrics
Whether metrics from our Altinity.Cloud environment are being sent to a Prometheus server or a Prometheus server is scraping metrics from our environment, we want to explore that data. Grafana Cloud makes it easy to do that; we need to explore the Prometheus data source (grafana-dougtidwell-prom in our example).
Note: We’re using a Prometheus service hosted by Grafana Cloud here. For other Prometheus providers, you’ll need to know the address of the server, its credentials, and how to use the PromQL language to query your metrics. We’ll do things the easy way here.
Click the Grafana menu in the upper left corner, then select the Metrics menu:

Figure 9 - The Metrics menu item
The Metrics page lets you look at the metrics from your Altinity.Cloud environment without writing PromQL queries. Click the  button to explore a new set of metrics. When you do, you’ll see a list of all your Prometheus data sources:
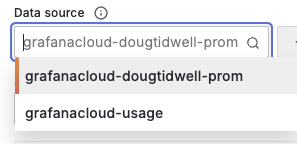
Figure 10 - The available Prometheus data sources
We’ll select the grafanacloud-dougtidwell-prom server. A very long page of visualizations will appear:

Figure 11 - Prometheus metrics with no labels selected
Every metric sent to the Prometheus server has one or more labels attached to it. We can filter what we see by selecting one or more labels. Click the  button to add a label to the query. When you click the button, you’ll see a dropdown list of labels from all the metrics sent to this server:
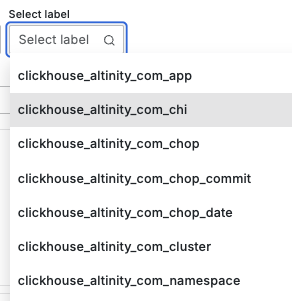
Figure 12 - List of labels in the metrics data
With a label selected, you’ll get a dropdown list of all the values for that label:
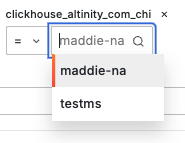
Figure 13 - List of values for a label
(The Altinity.Cloud environment we’re using here contains ClickHouse clusters named maddie-na and testms.)
The page is filtered to show only visualizations of data tagged with the label and value you selected. In this example, that means everything with a label of clickhouse_altinity_com_chi and a value of maddie-na:

Figure 14 - A filtered set of visualizations
Each visualization is labeled with the name of the metric itself. Clicking the ![]() icon displays the datatype of the value:
icon displays the datatype of the value:

Figure 15 - Click the icon to see a metric’s datatype