Read your query plan as a graph
EXPLAIN PIPELINE tells you how ClickHouse will actually run a query. It just tells you in a wall of text.
ClickHouse has one of the better EXPLAIN families around.
EXPLAIN PIPELINE in particular shows the physical processors — the things that
actually read, transform, aggregate and merge your data — and how they fan out across threads. The
catch is the output: an indented text tree that's precise and nearly unreadable past a dozen lines.
So the browser draws it. Click Explain on any query and you get five tabs — Explain, Indexes, Projections, Pipeline, Estimate — and the Pipeline tab lays the processor graph out as boxes and arrows. Pan it, zoom it, pop it fullscreen.
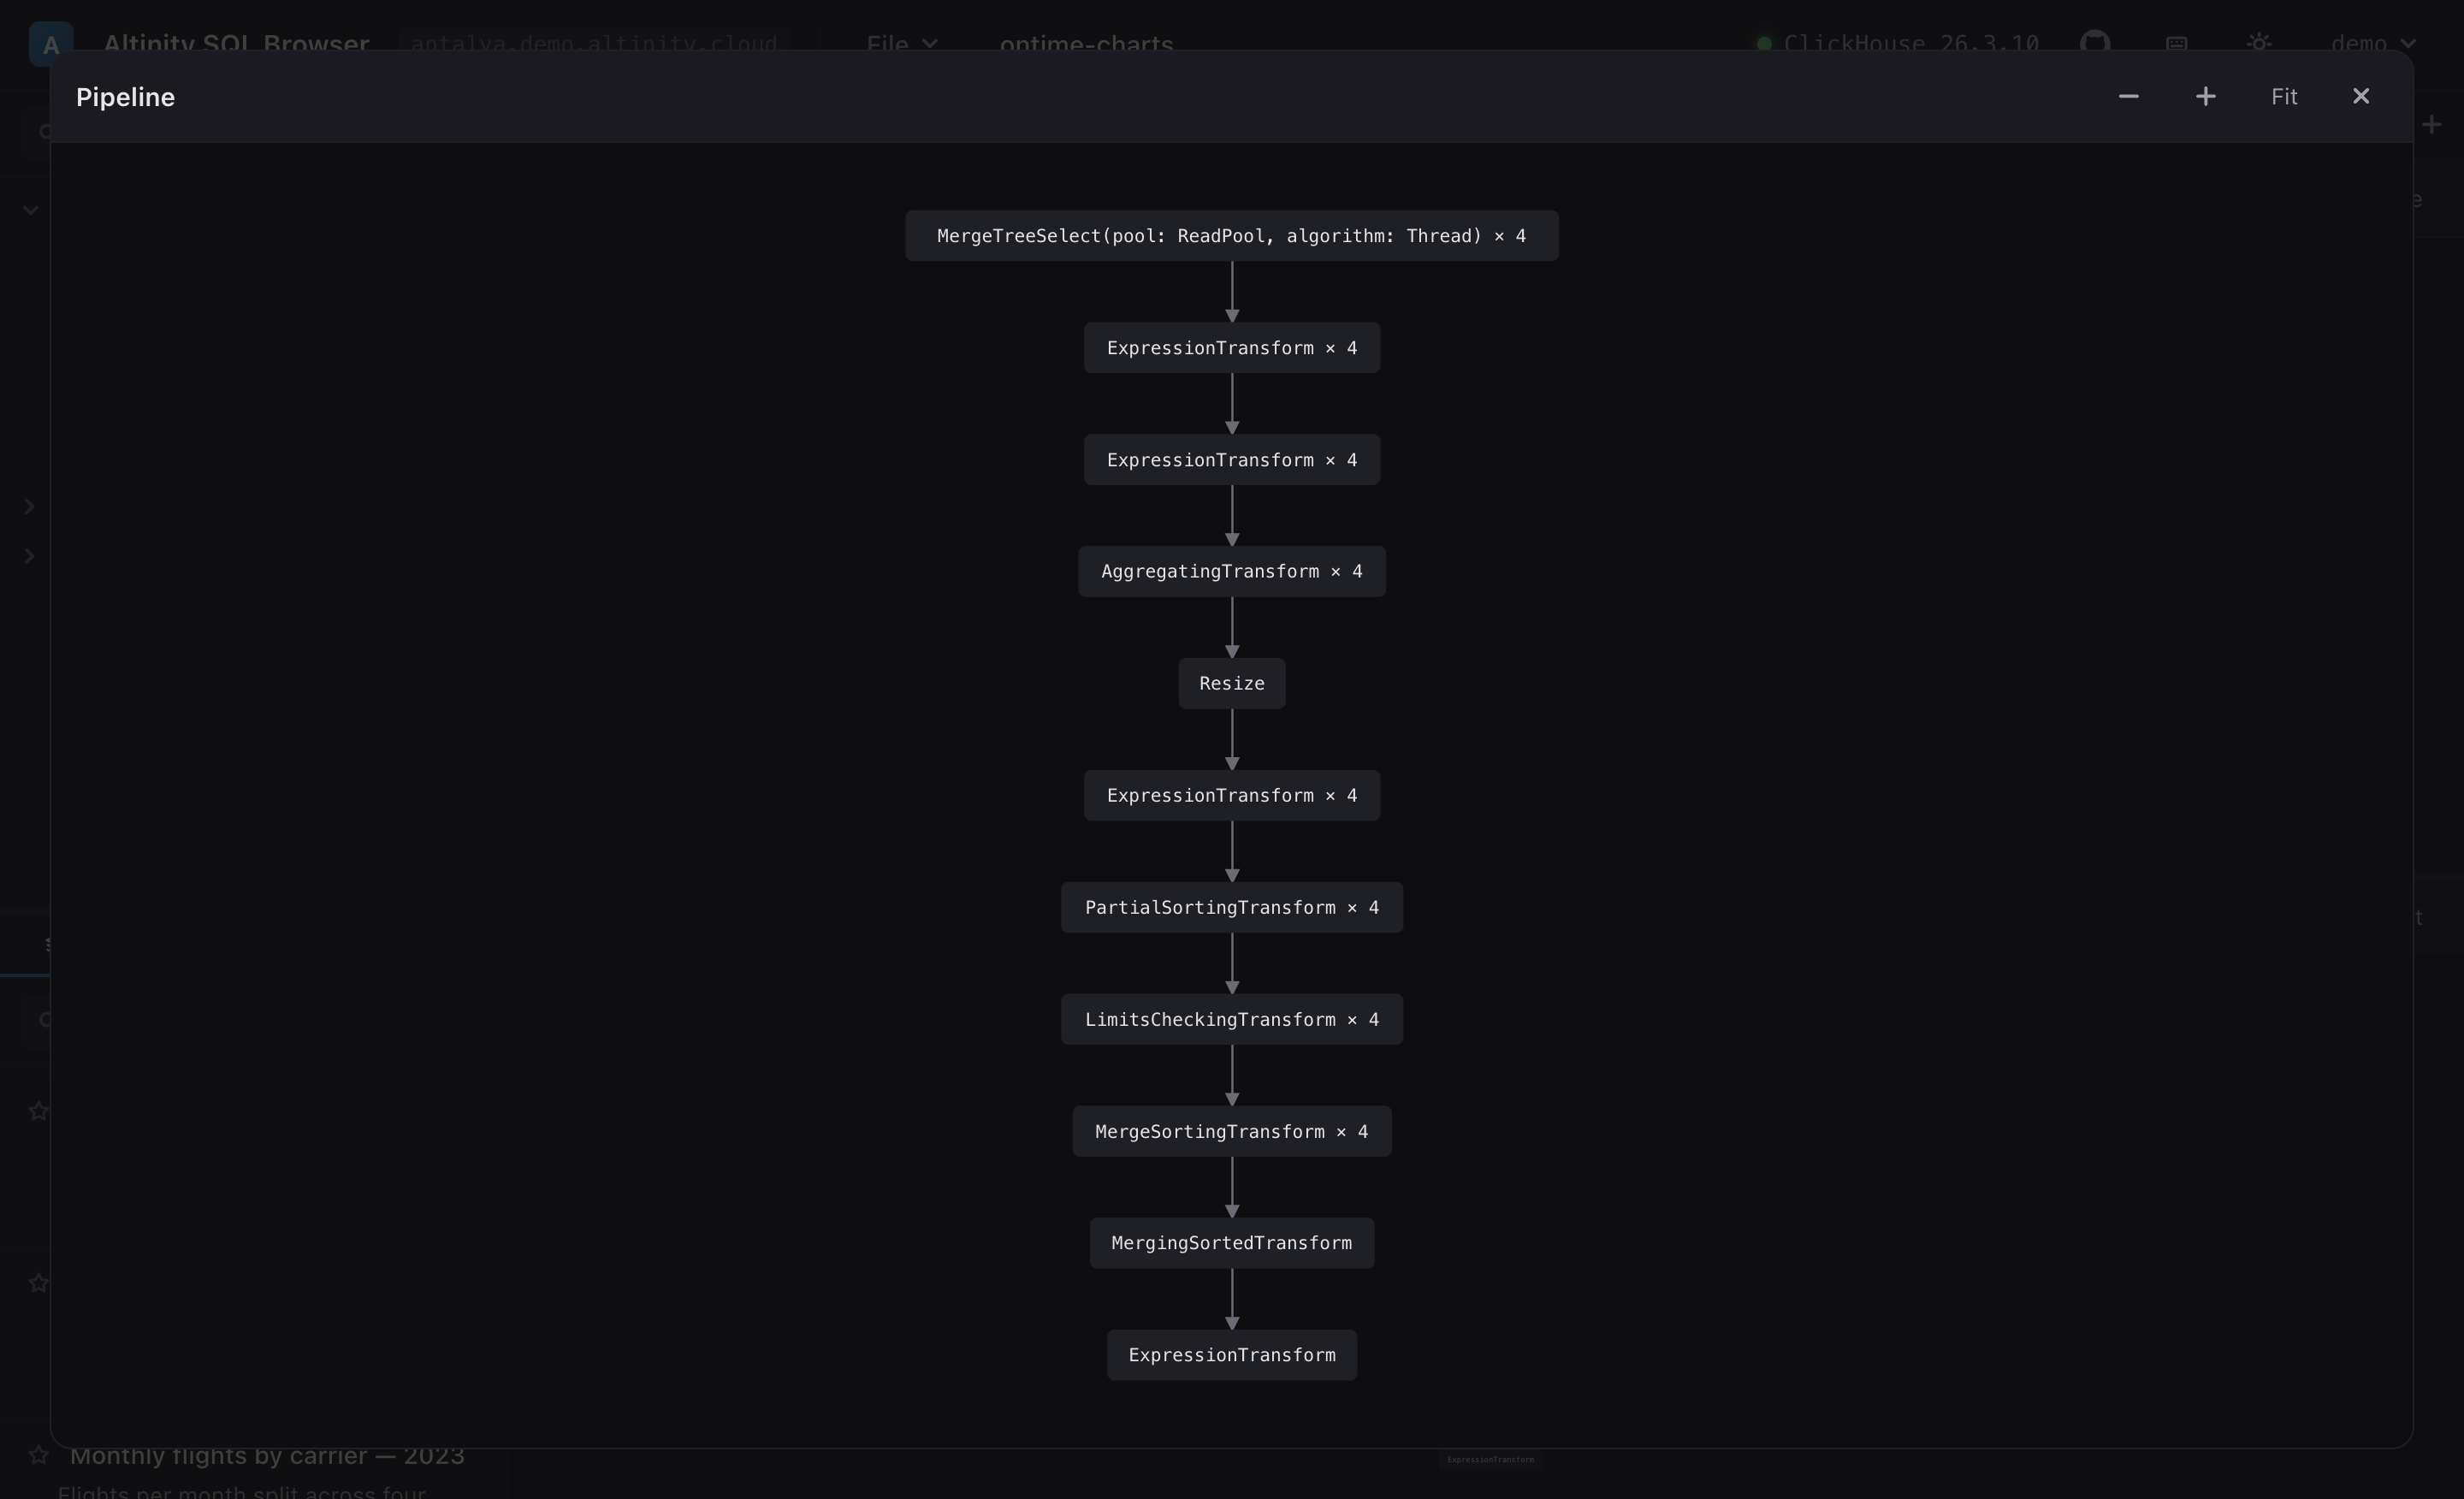
EXPLAIN PIPELINE for a GROUP BY … ORDER BY, drawn as a processor DAG.Once it's a picture, the shape tells you things the text buries. Read the graph above top to bottom:
MergeTreeSelect × 4— four parallel reading lanes. That× 4is your parallelism: how many threads pull parts at once.AggregatingTransform × 4— theGROUP BYruns per-lane, in parallel, after a couple of expression steps.Resize— the funnel. Parallel lanes collapse toward fewer. This is where parallel work becomes serial, and it's usually the first place to look when a query is slower than it should be.PartialSorting → MergeSorting → MergingSortedTransform— theORDER BY: sort each lane, then merge the sorted streams.
You start to read these the way you read a flame graph. Wide and parallel up top, a
Resize in the middle, a merge at the bottom — that's a healthy aggregate-and-sort.
A pipeline that stays one box wide the whole way down is single-threaded, and now you can see that
instead of guessing at it.
It doesn't touch your query
A small thing I appreciate: hitting Explain doesn't rewrite your editor. The app wraps your statement
in EXPLAIN behind the scenes and shows the result in the results pane — your SQL
stays exactly as you typed it. The Indexes and Projections tabs run
EXPLAIN indexes = 1 / projections = 1, which answer the
question you usually have when a query scans more than it should: are my skip indexes and projections
actually being used?
It's the kind of thing that's obvious the first time and slightly annoying to live without after.
Paste a real GROUP BY into the live demo
and hit Explain → Pipeline.