Map the materialized-view web before it bites
A mature ClickHouse schema is a graph. Most tools show you a list.
Here's a thing that happens. You go to drop a "temporary" table, or change a column type, and an hour later something three hops away has quietly stopped ingesting. The table fed a materialized view you'd forgotten about, which wrote to an aggregate that another view read through a dictionary. ClickHouse will happily let you build these chains. It just won't draw them for you.
The SQL Browser does. Drag a database — or a single table — from the sidebar onto the results pane, and it builds a graph of how the objects actually connect.

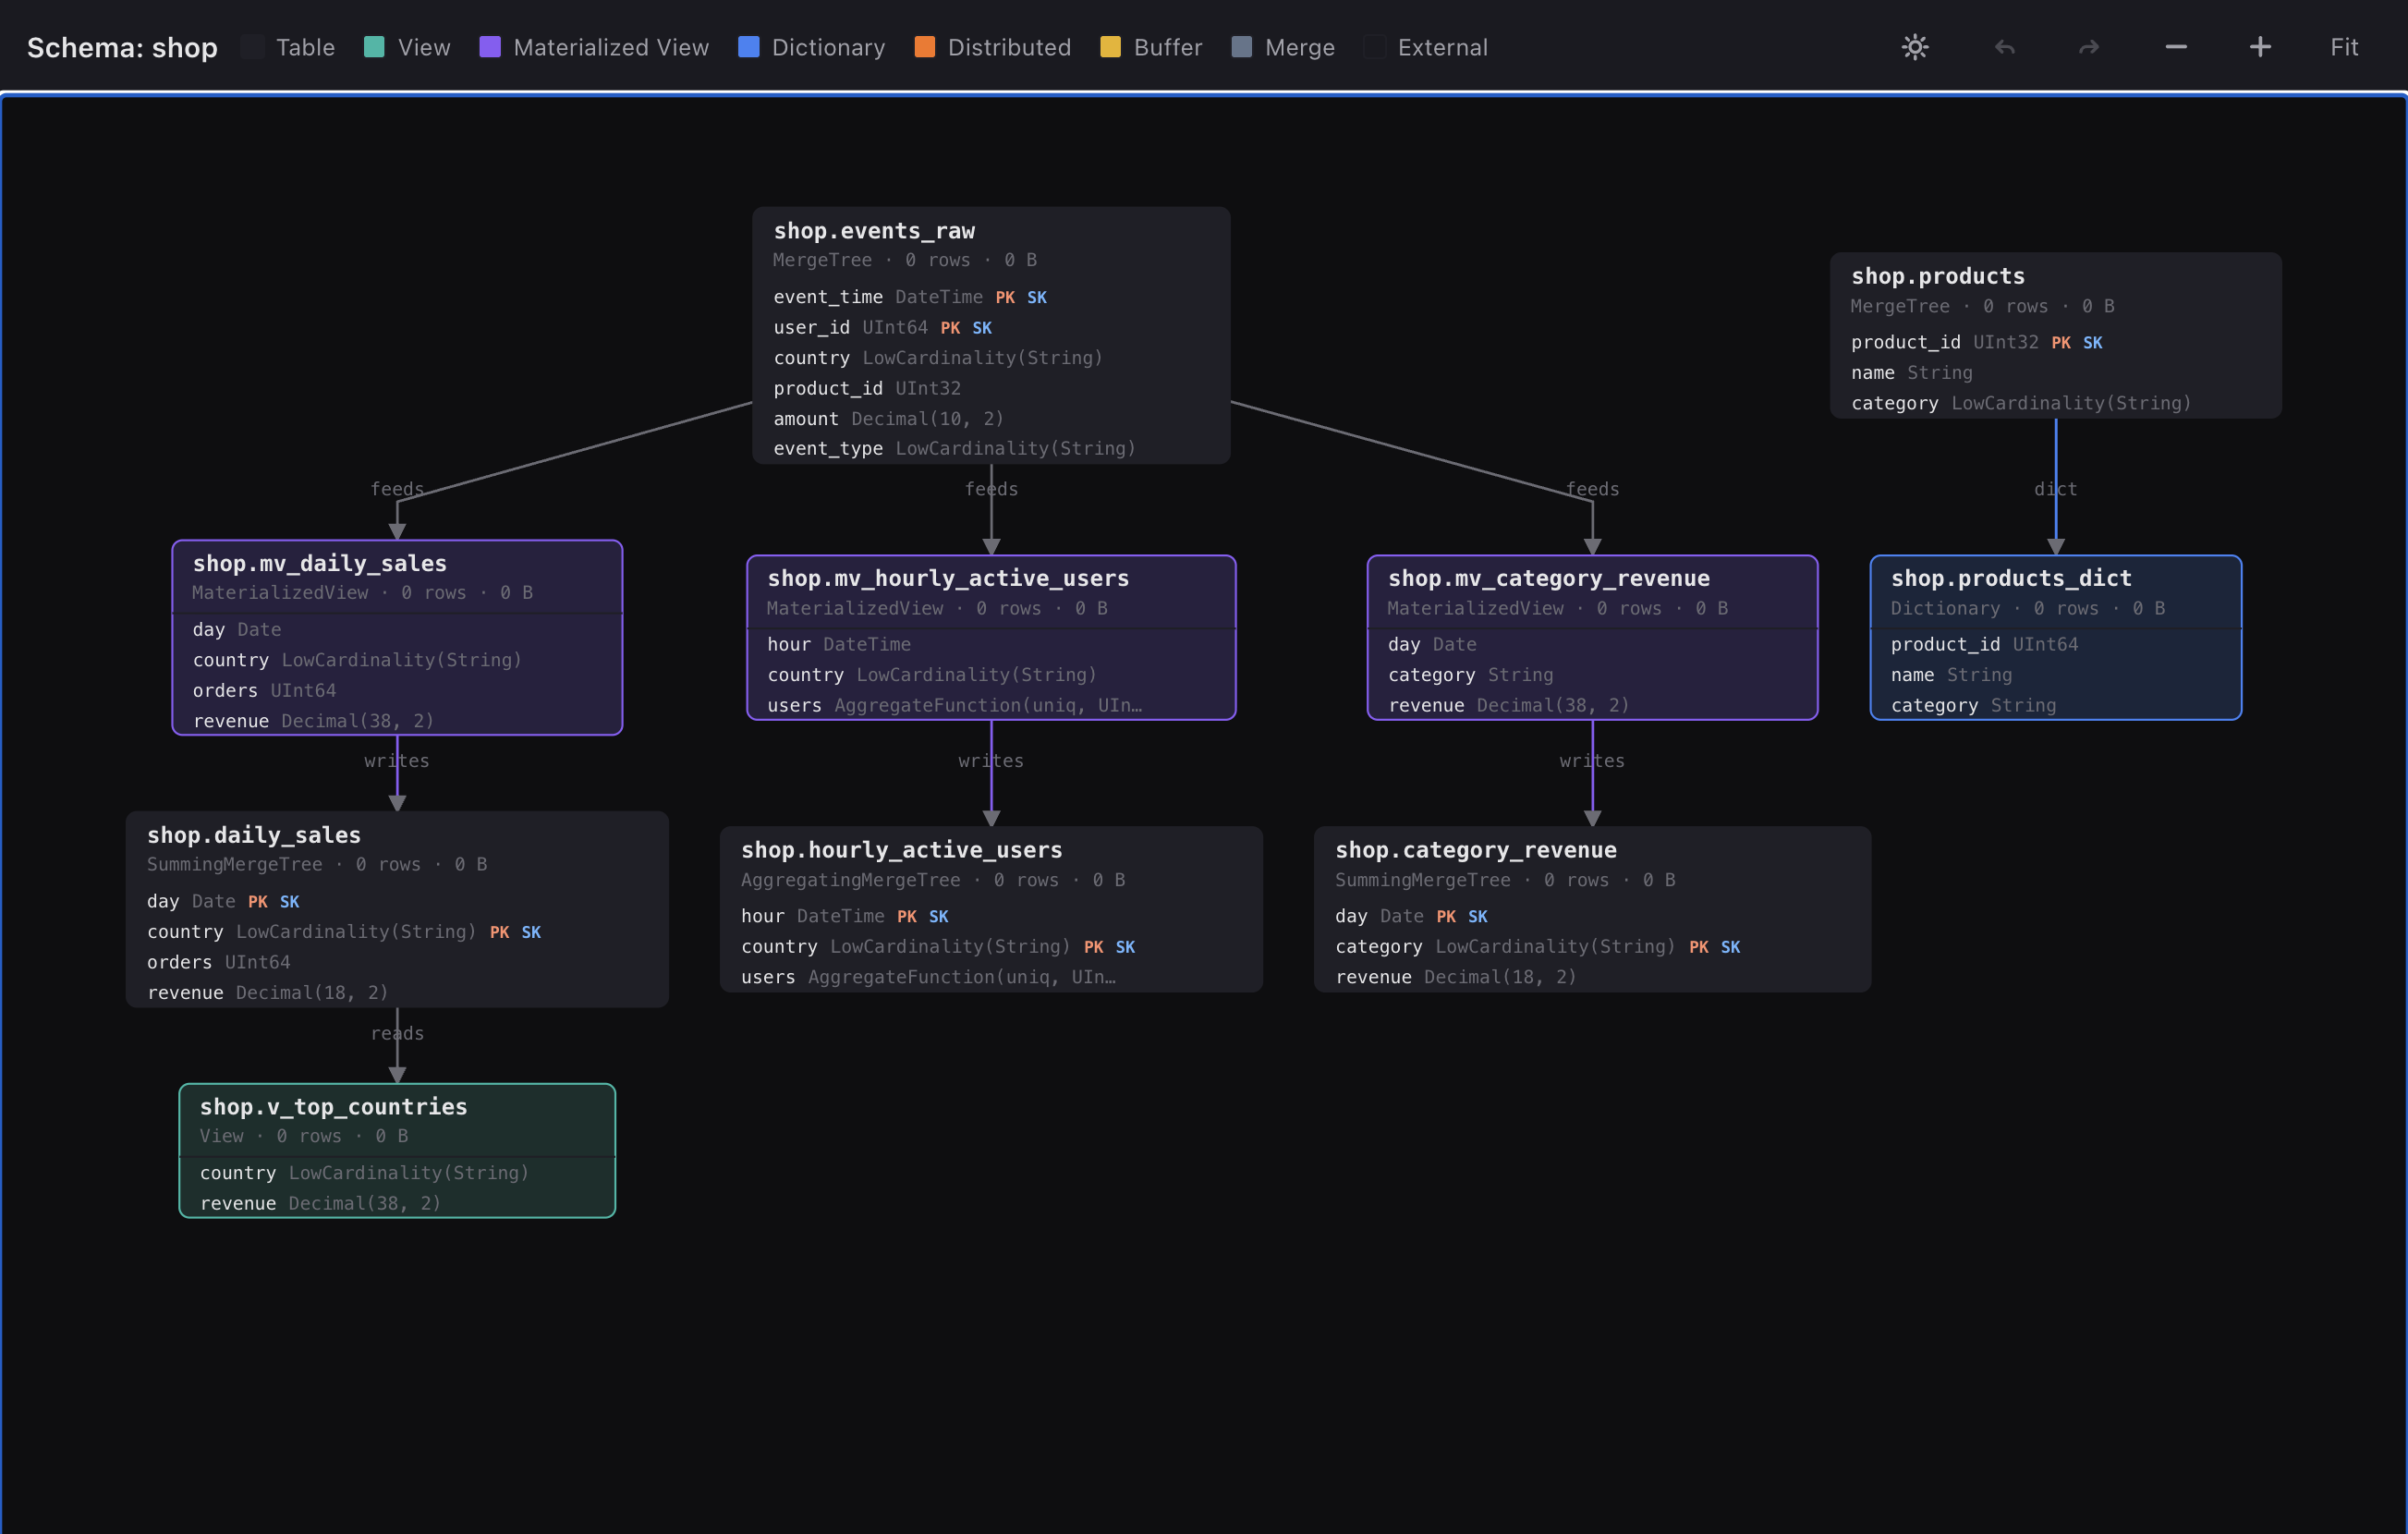
shop demo: events_raw feeds three MVs that write to aggregates; products feeds a dictionary; v_top_countries reads daily_sales.The edges are typed, because in ClickHouse the relationships are. A materialized view
feeds from its sources and writes to its target. A plain view reads its
sources. A dictionary pulls from a source table (dict). A Distributed,
Buffer or Merge table points at what it wraps. Nodes are
coloured by engine, so it's obvious at a glance which box is an MV and which is a dictionary.
Where the edges come from
This is the part I actually care about. Discovery is structured-first, parse-fallback. When
ClickHouse fills in the helpful columns — system.tables.dependencies_table,
loading_dependencies_*, system.dictionaries.source — we use
them. When it doesn't (older builds, or an engine that leaves them empty), we fall back: an
EXPLAIN AST to find what a view selects from, and a parse of
create_table_query / engine_full for an MV's
TO target or a Distributed table's arguments.
Every lookup is best-effort. A denied system table or a missing column degrades that one layer — you
might lose dictionary edges — but the graph still draws. It never throws up its hands and shows you
nothing. (Concretely: if your role lacks SELECT ON system.dictionaries you'll
see the dictionary node without its source edge; grant it and the edge appears.)
Read it, then dig in
Hit Expand and the graph opens in its own browser tab as rich cards — each object
with its engine, row and byte counts, and full column list with PK/SK
badges. Click a node for a side pane with columns, keys, partitions and the SHOW CREATE.
Drag nodes around; the layout has undo/redo. Discovery is transitive and crosses database boundaries,
so a view in one database that reads a table in another shows the hop.
And a database of unrelated tables still renders — you get the tables as standalone nodes, not an empty screen. The graph is honest about what's connected and what isn't.
Fastest way to see it on your terms: open the live demo
and drag the shop database onto the results pane — that's the graph above, against
real data. The mechanics are on the Features page.