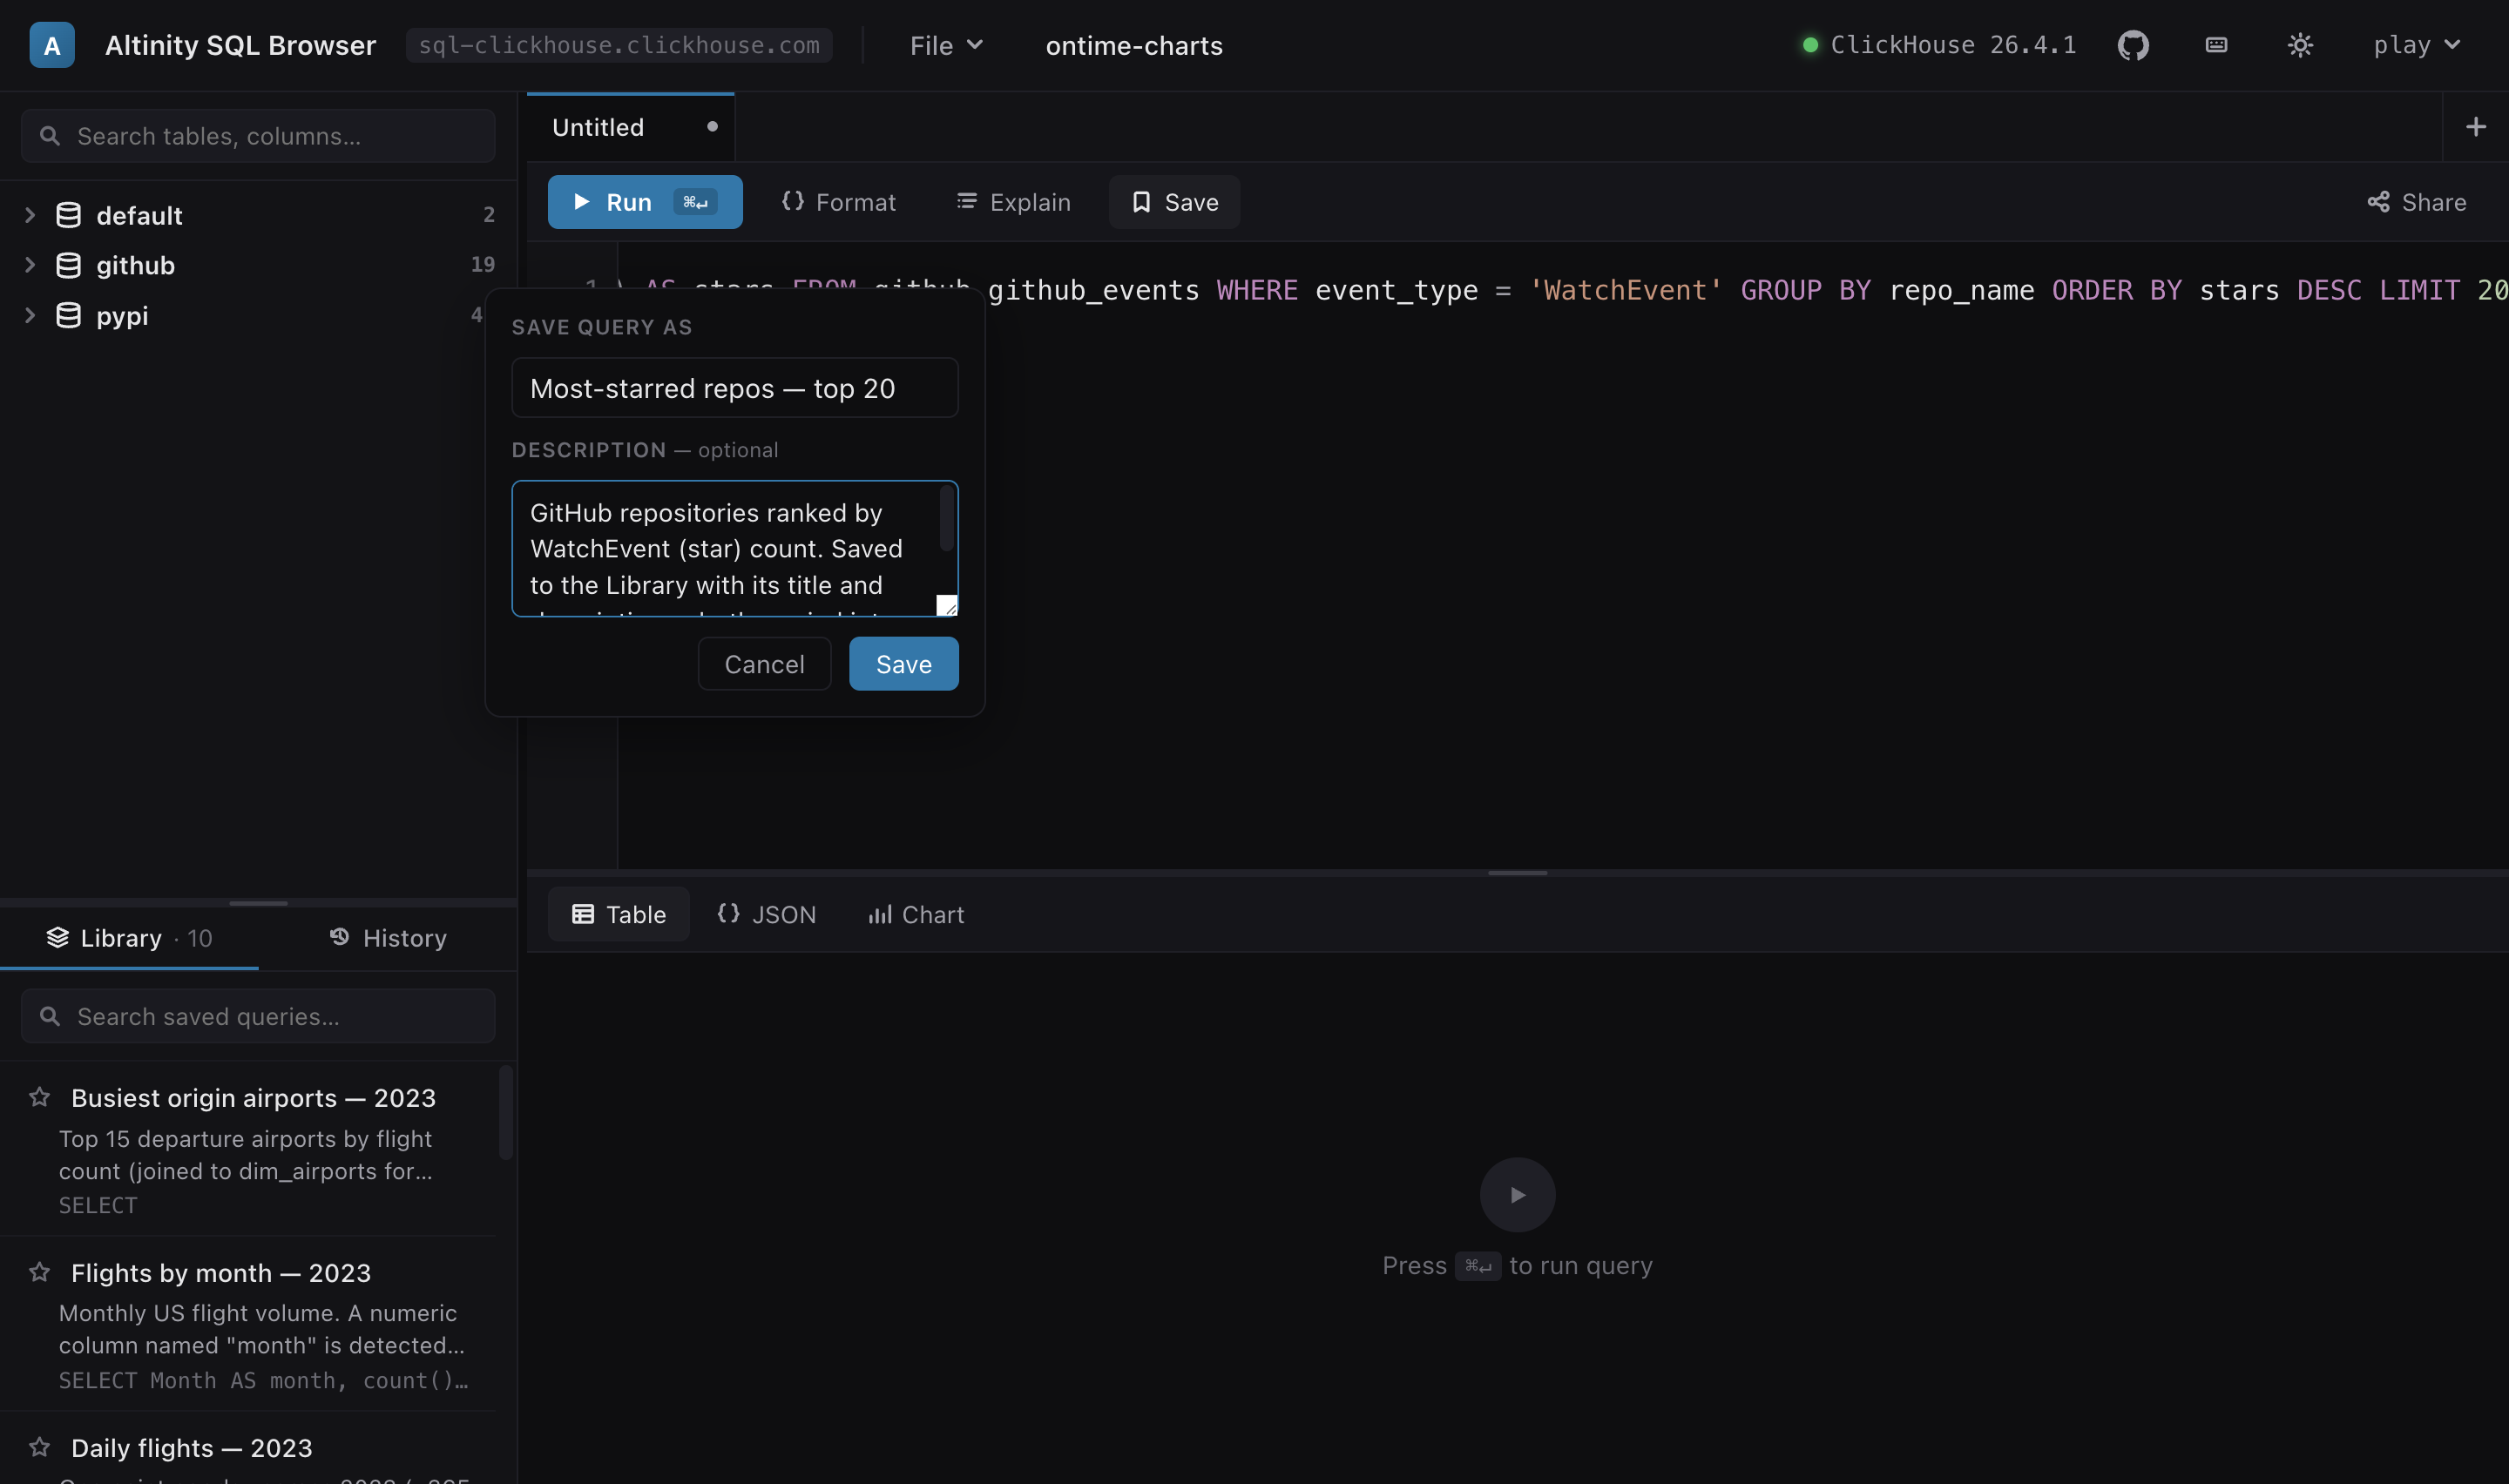
A custom editor, rich result views, query plans you can see, and a map of how your tables connect — all without a single third-party request.
Google, Auth0, Okta and friends — Authorization-Code + PKCE, discovered from /.well-known/openid-configuration. The login screen can offer several providers.
HTTP Basic username/password for clusters without OAuth, including username-only connect for demo clusters. Tokens and credentials live only in sessionStorage.
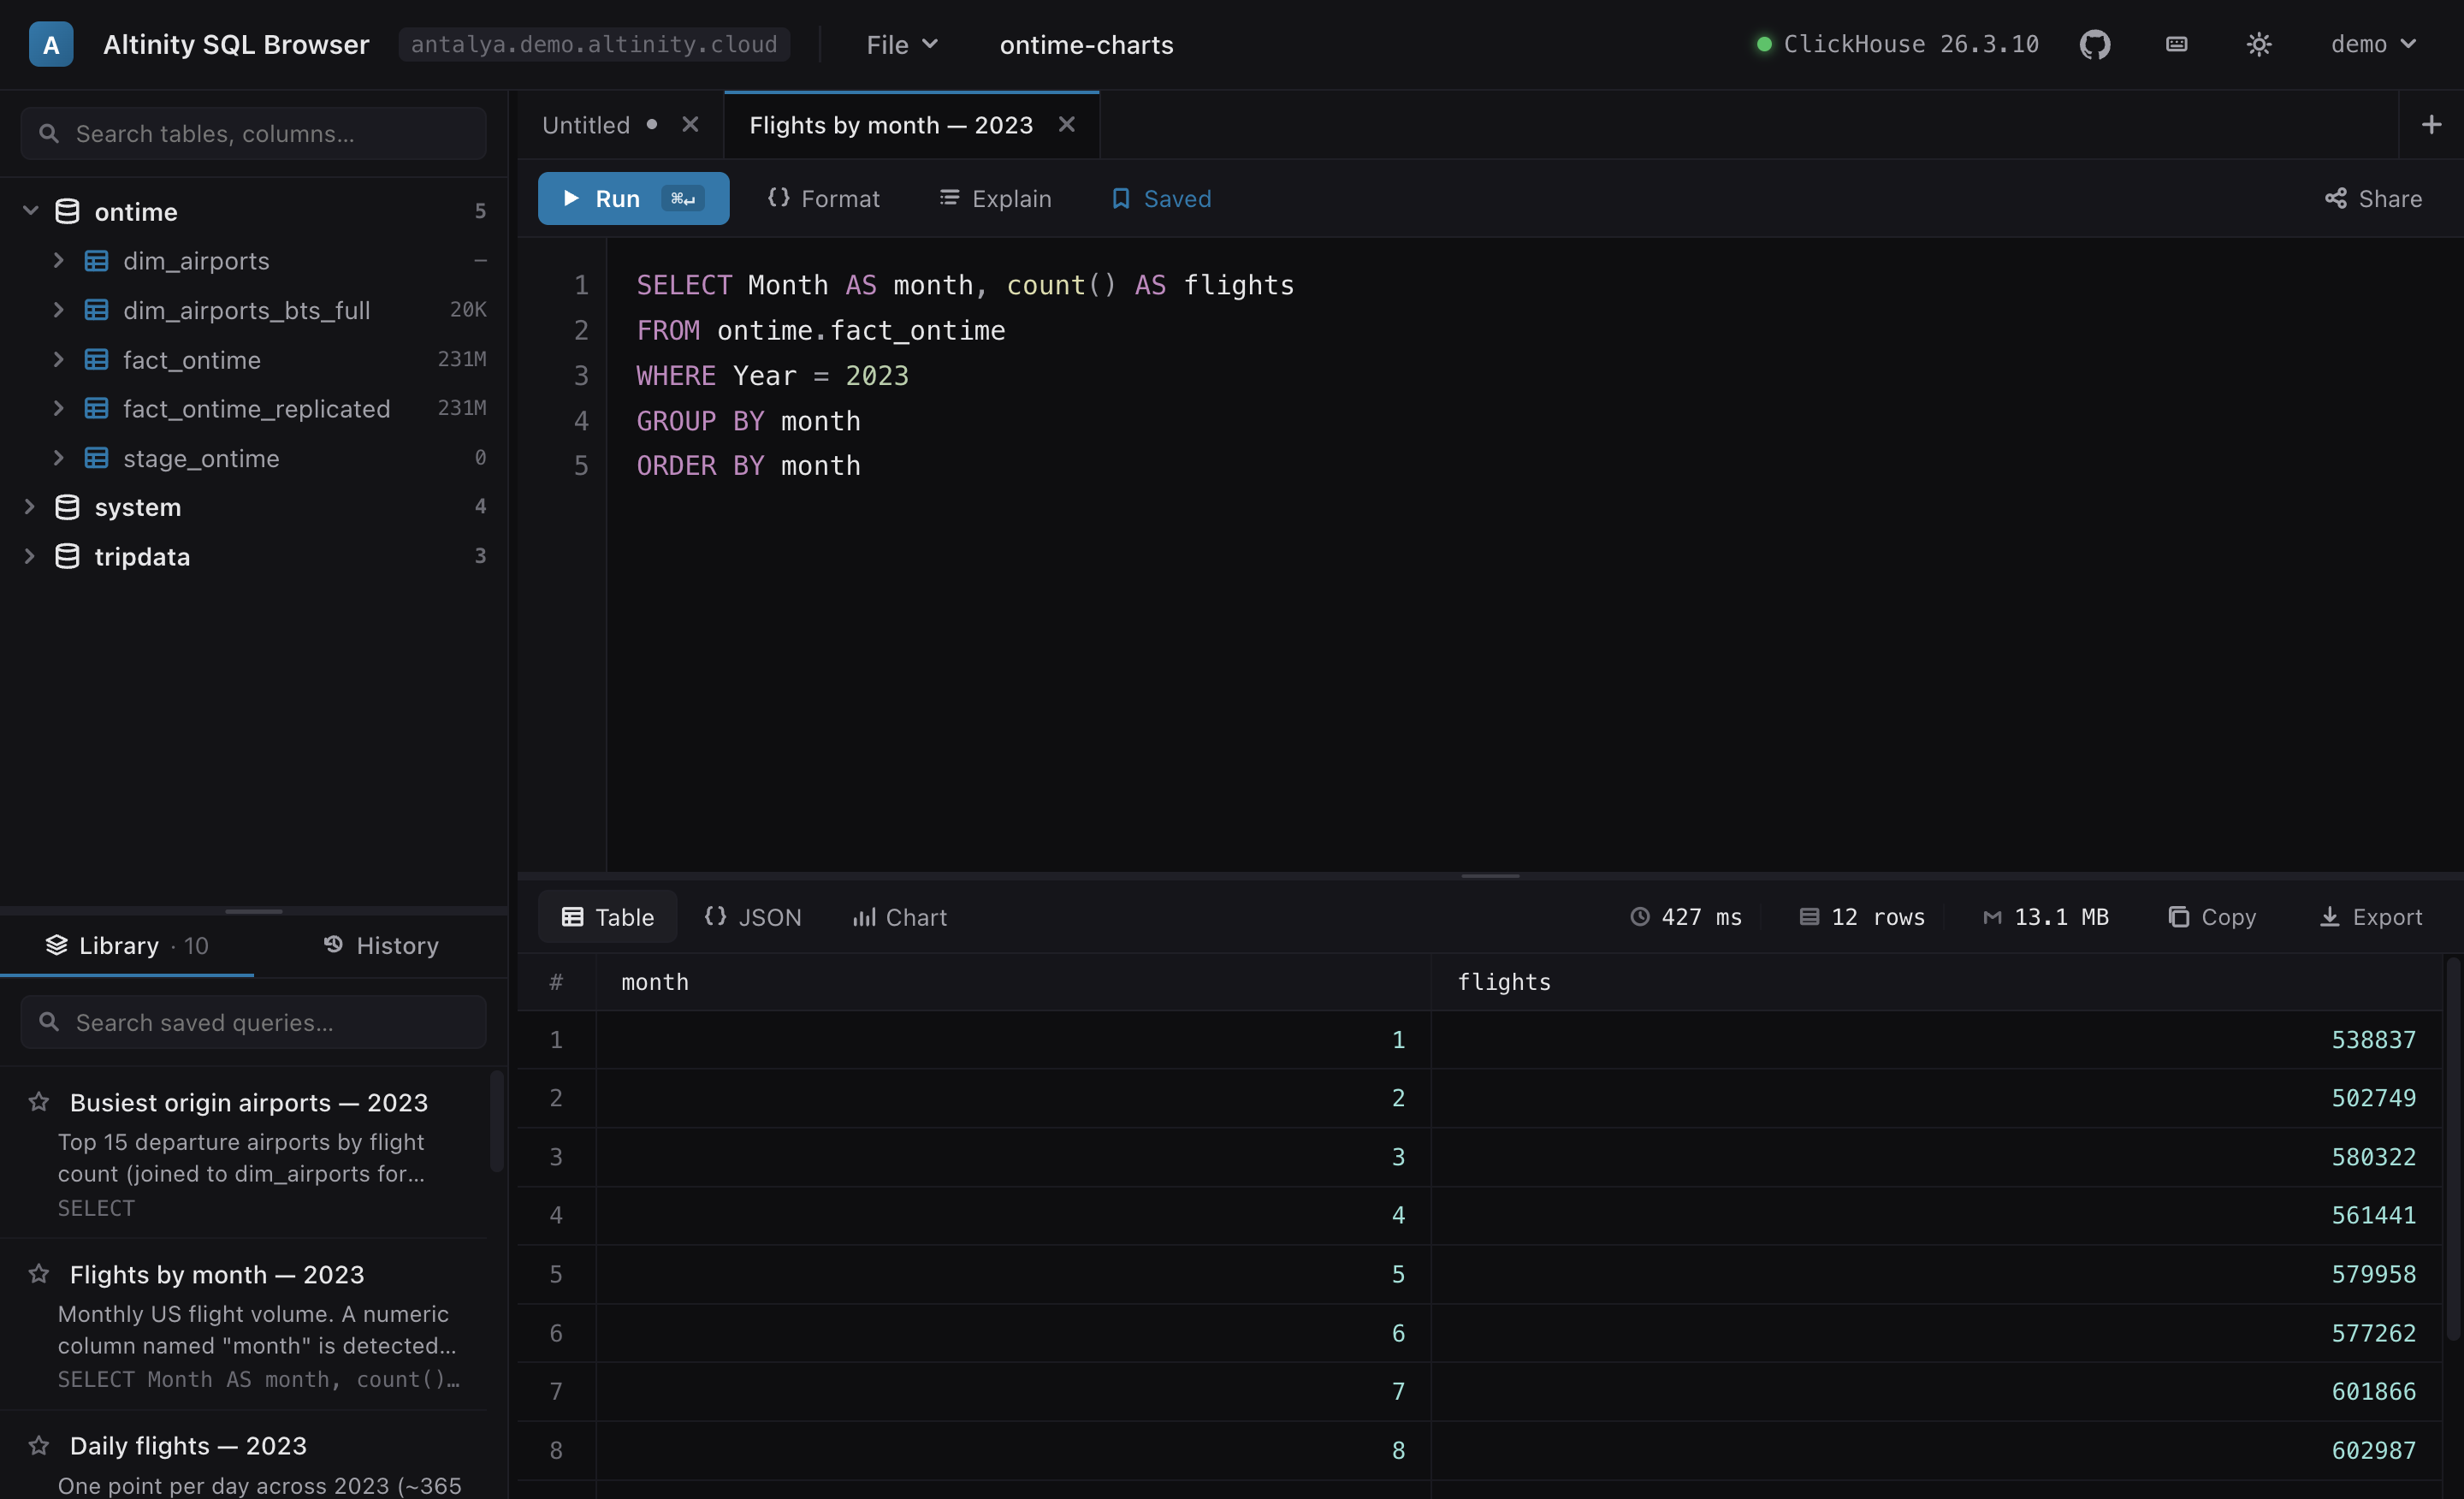
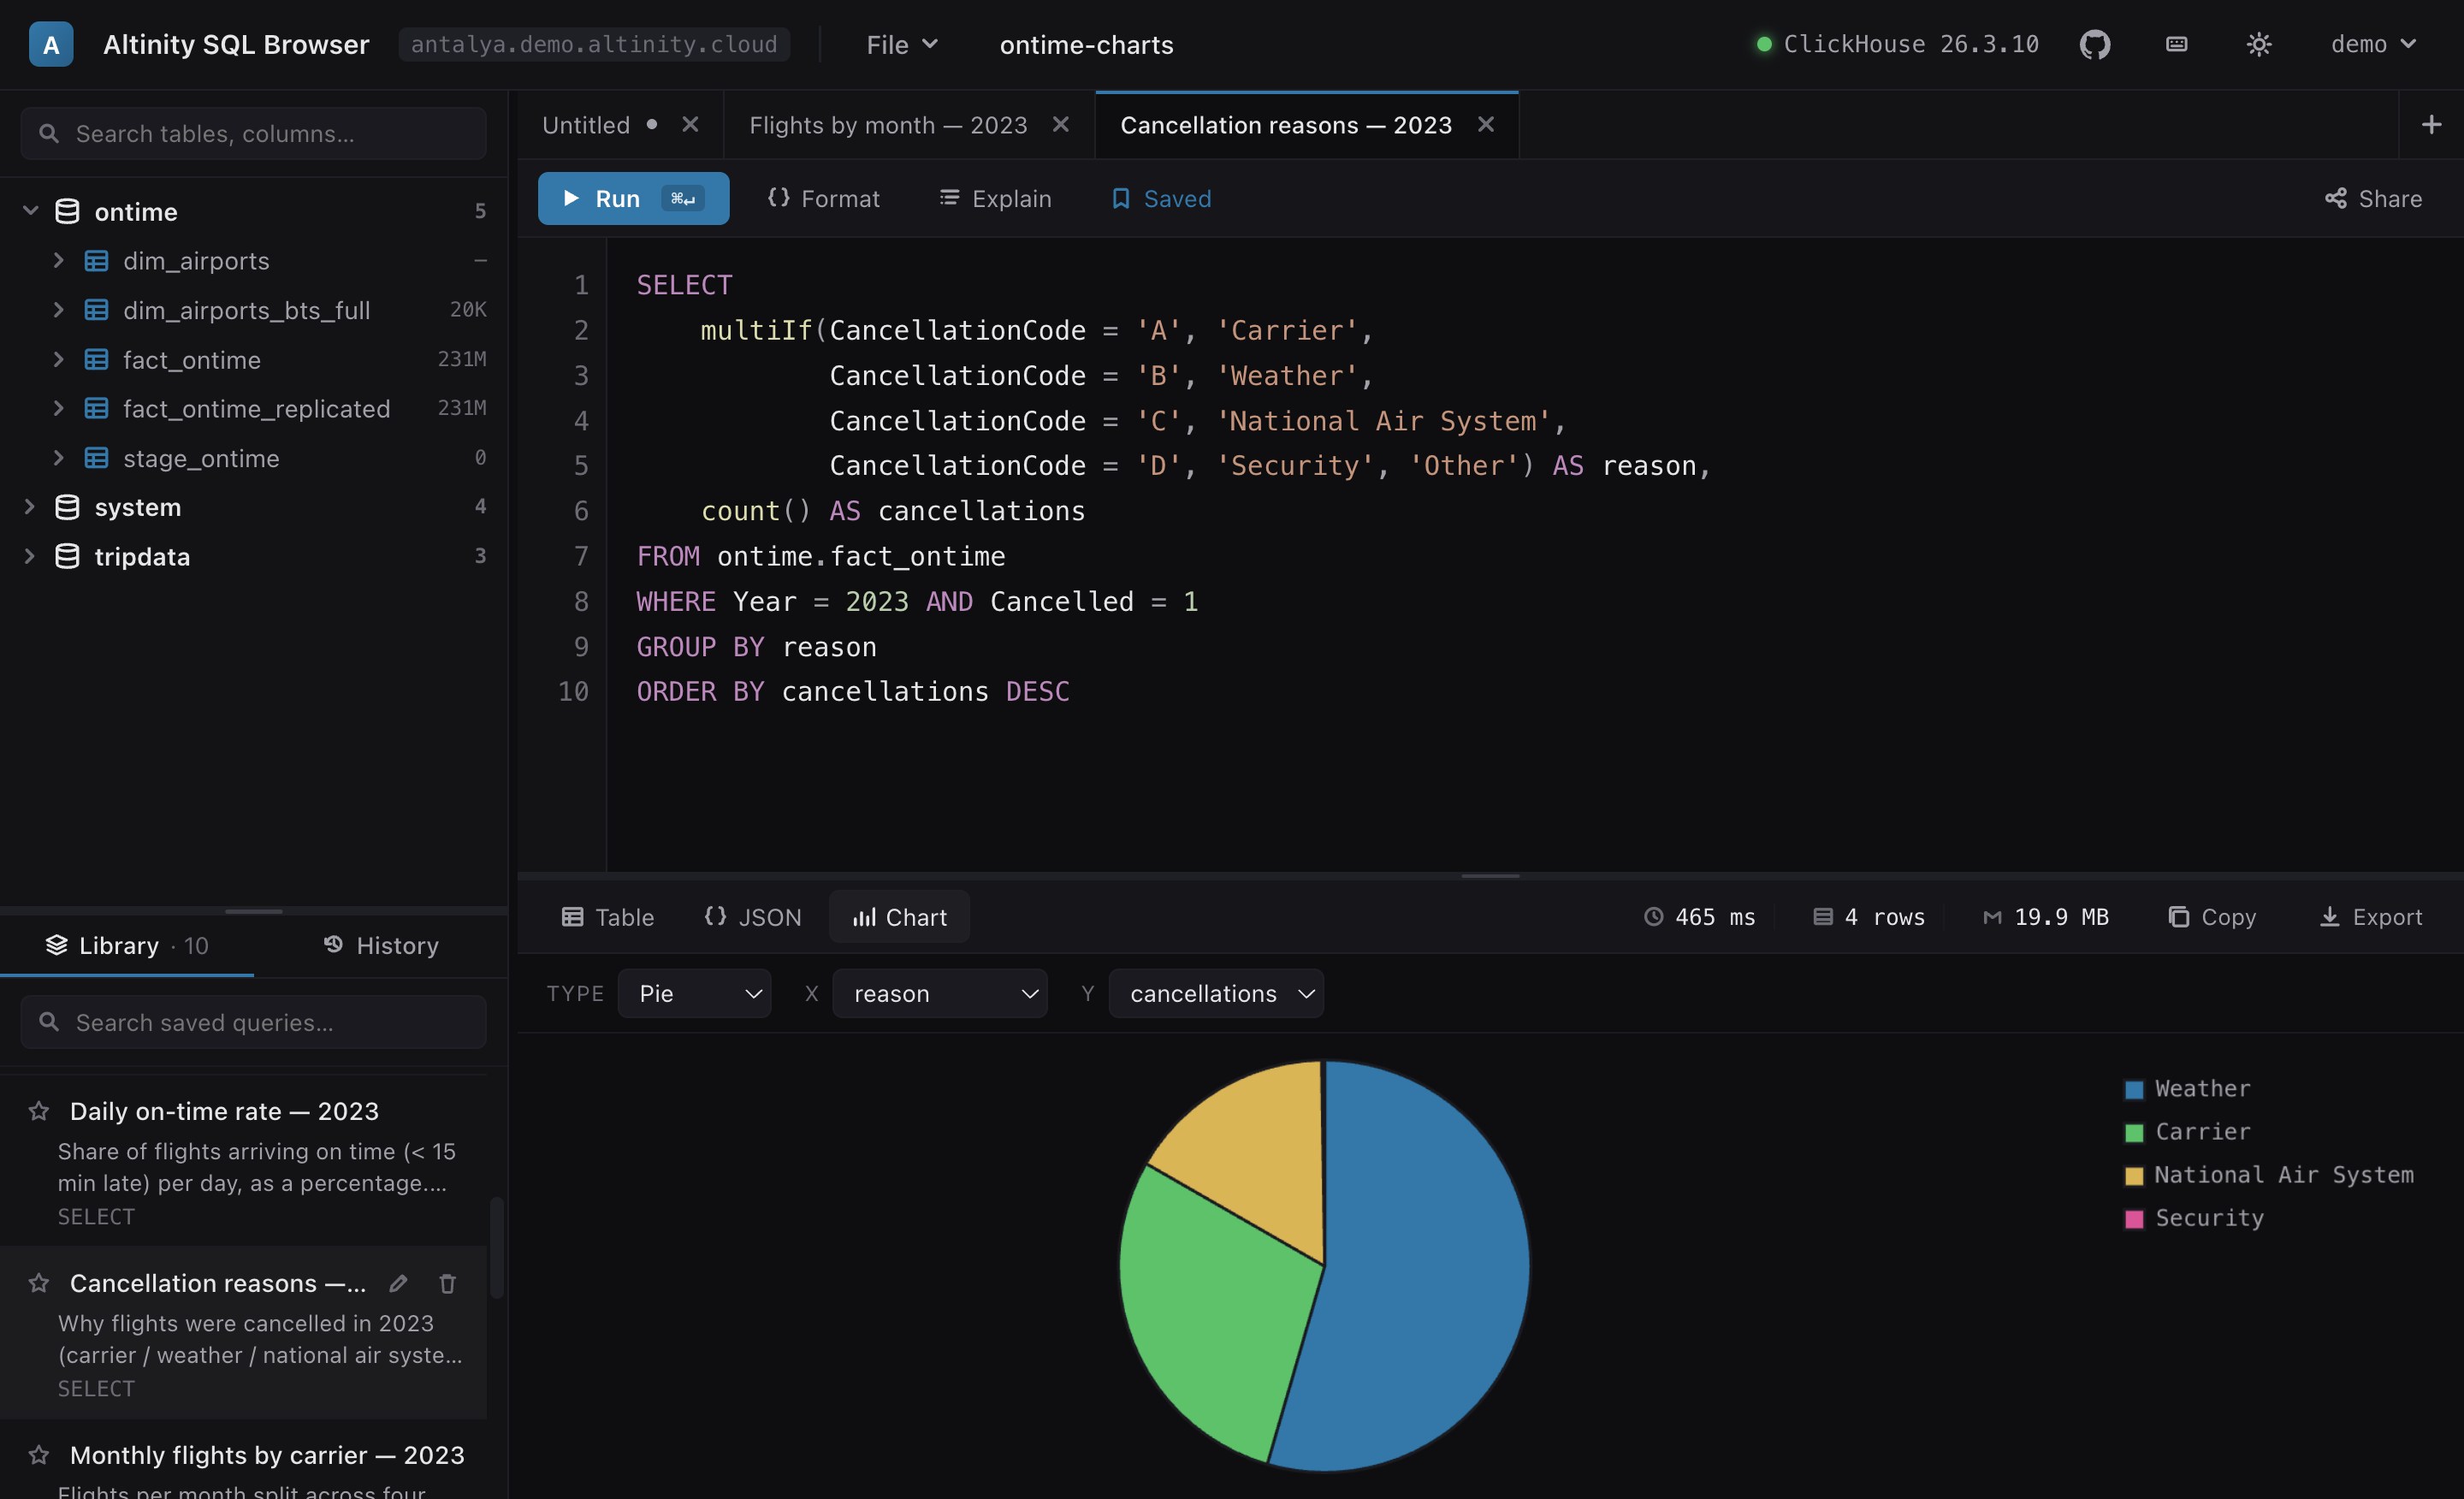
Every result set switches between a sortable table, raw JSON, and a chart — without re-running. The table gives type-aware columns, NULL styling and row numbers, with live row, byte and elapsed-time stats in the toolbar.

A small categorical breakdown becomes a pie with a legend; a time series becomes a line. The same result is one click away from a clean table with sortable, type-aware columns and live row/byte/time stats.
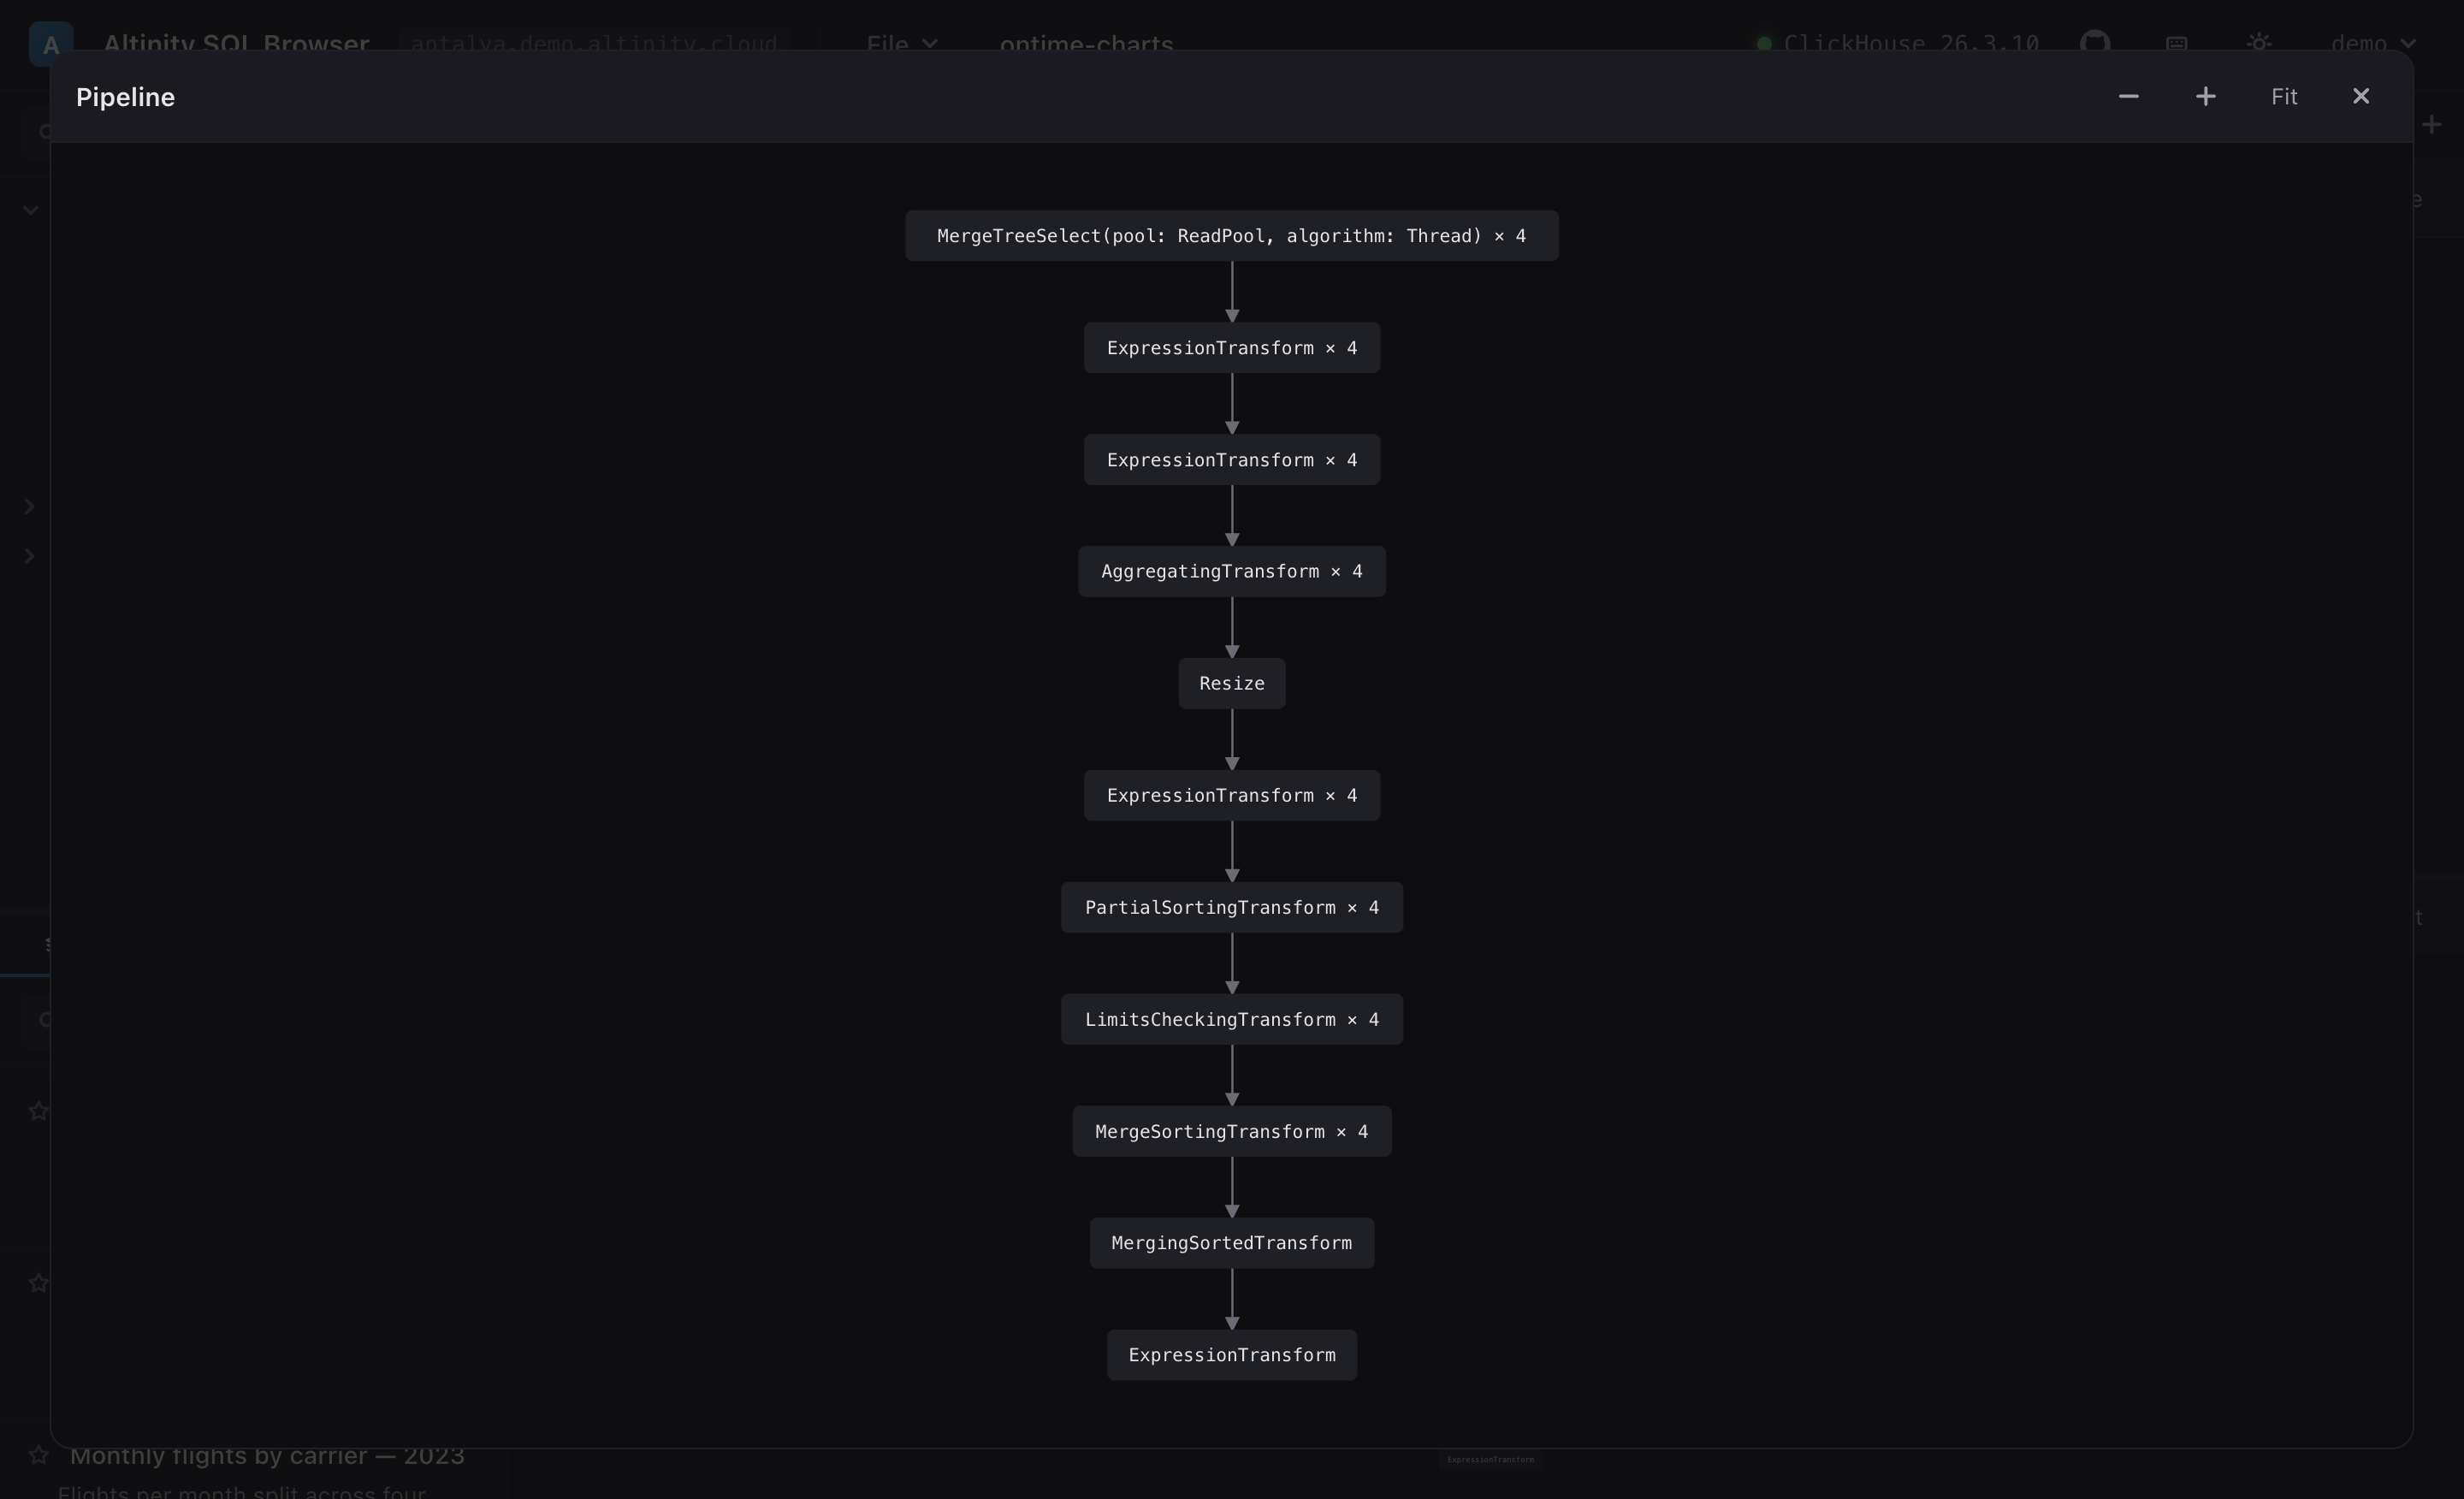
One Explain click gives five views — Explain, Indexes, Projections, Pipeline and
Estimate. The Pipeline view renders EXPLAIN PIPELINE graph as a real
boxes-and-arrows DAG you can pan, zoom and open fullscreen.

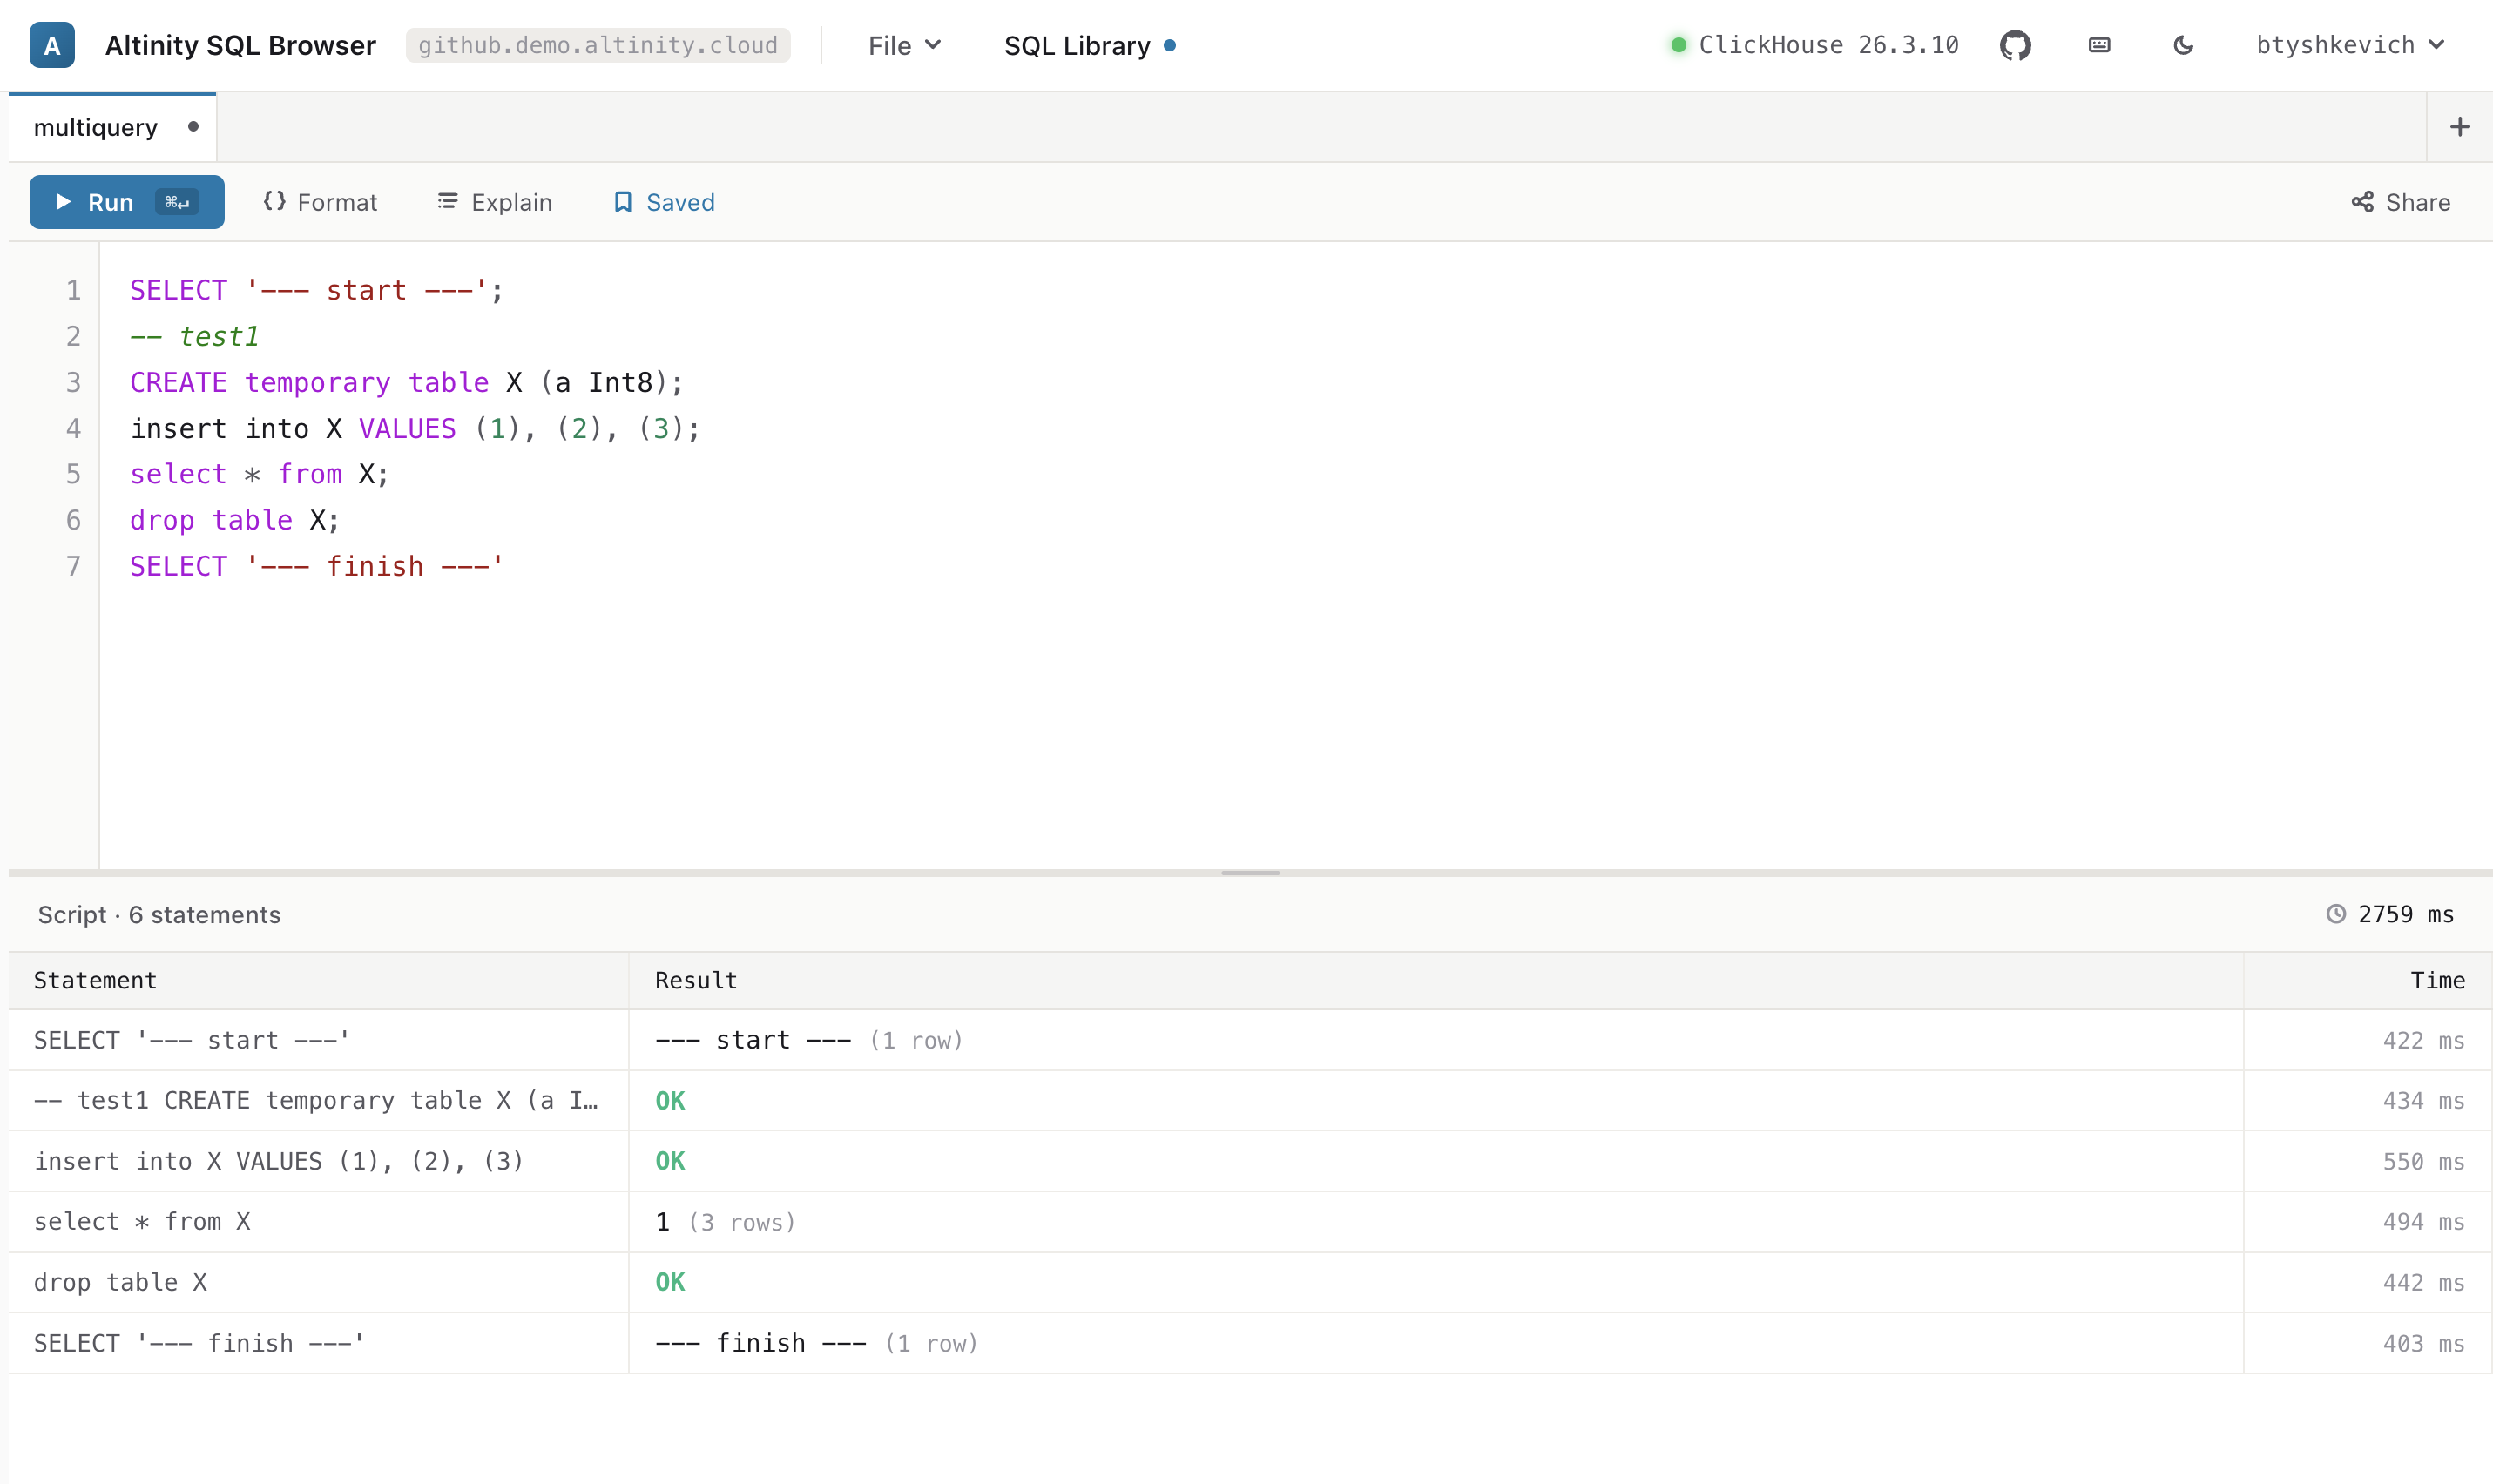
ClickHouse's HTTP interface runs exactly one statement per request. The browser splits a
;-separated script client-side and runs each statement in order — like
clickhouse-client --multiquery — stopping on the first error. You get a
per-statement grid: each row's result and its own time.
TEMPORARY table or a SET persists across the script — a session is attached when the script needs one
The result grid caps rows on purpose. Export doesn't touch it: it streams ClickHouse's response straight into a file you pick (via the File System Access API), so a multi-million-row export runs in flat memory — nothing is buffered in the page.
FORMAT Parquet /
CSV / JSONEachRow / Arrow …
streams verbatim with a matching extension; no FORMAT and you get
TabSeparatedWithNames.;-separated script and
pick a folder; each SELECT streams to its own NNN-slug.ext in one
shared session (so SET / CREATE TEMPORARY carry across).Needs Chromium + a secure context (the File System Access API); elsewhere the button stays visible but disabled, with a tooltip.
# one query → one file, streamed uncapped SELECT * FROM github.github_events FORMAT Parquet → github_events.parquet 4.2 GB · 12s # a multi-statement script → a folder of files etl-nightly/ 001-raw-events.parquet 4.2 GB 002-daily-rollup.csv 18 MB 003-top-accounts.tsv 2.1 MB (each SELECT streamed in one shared session)
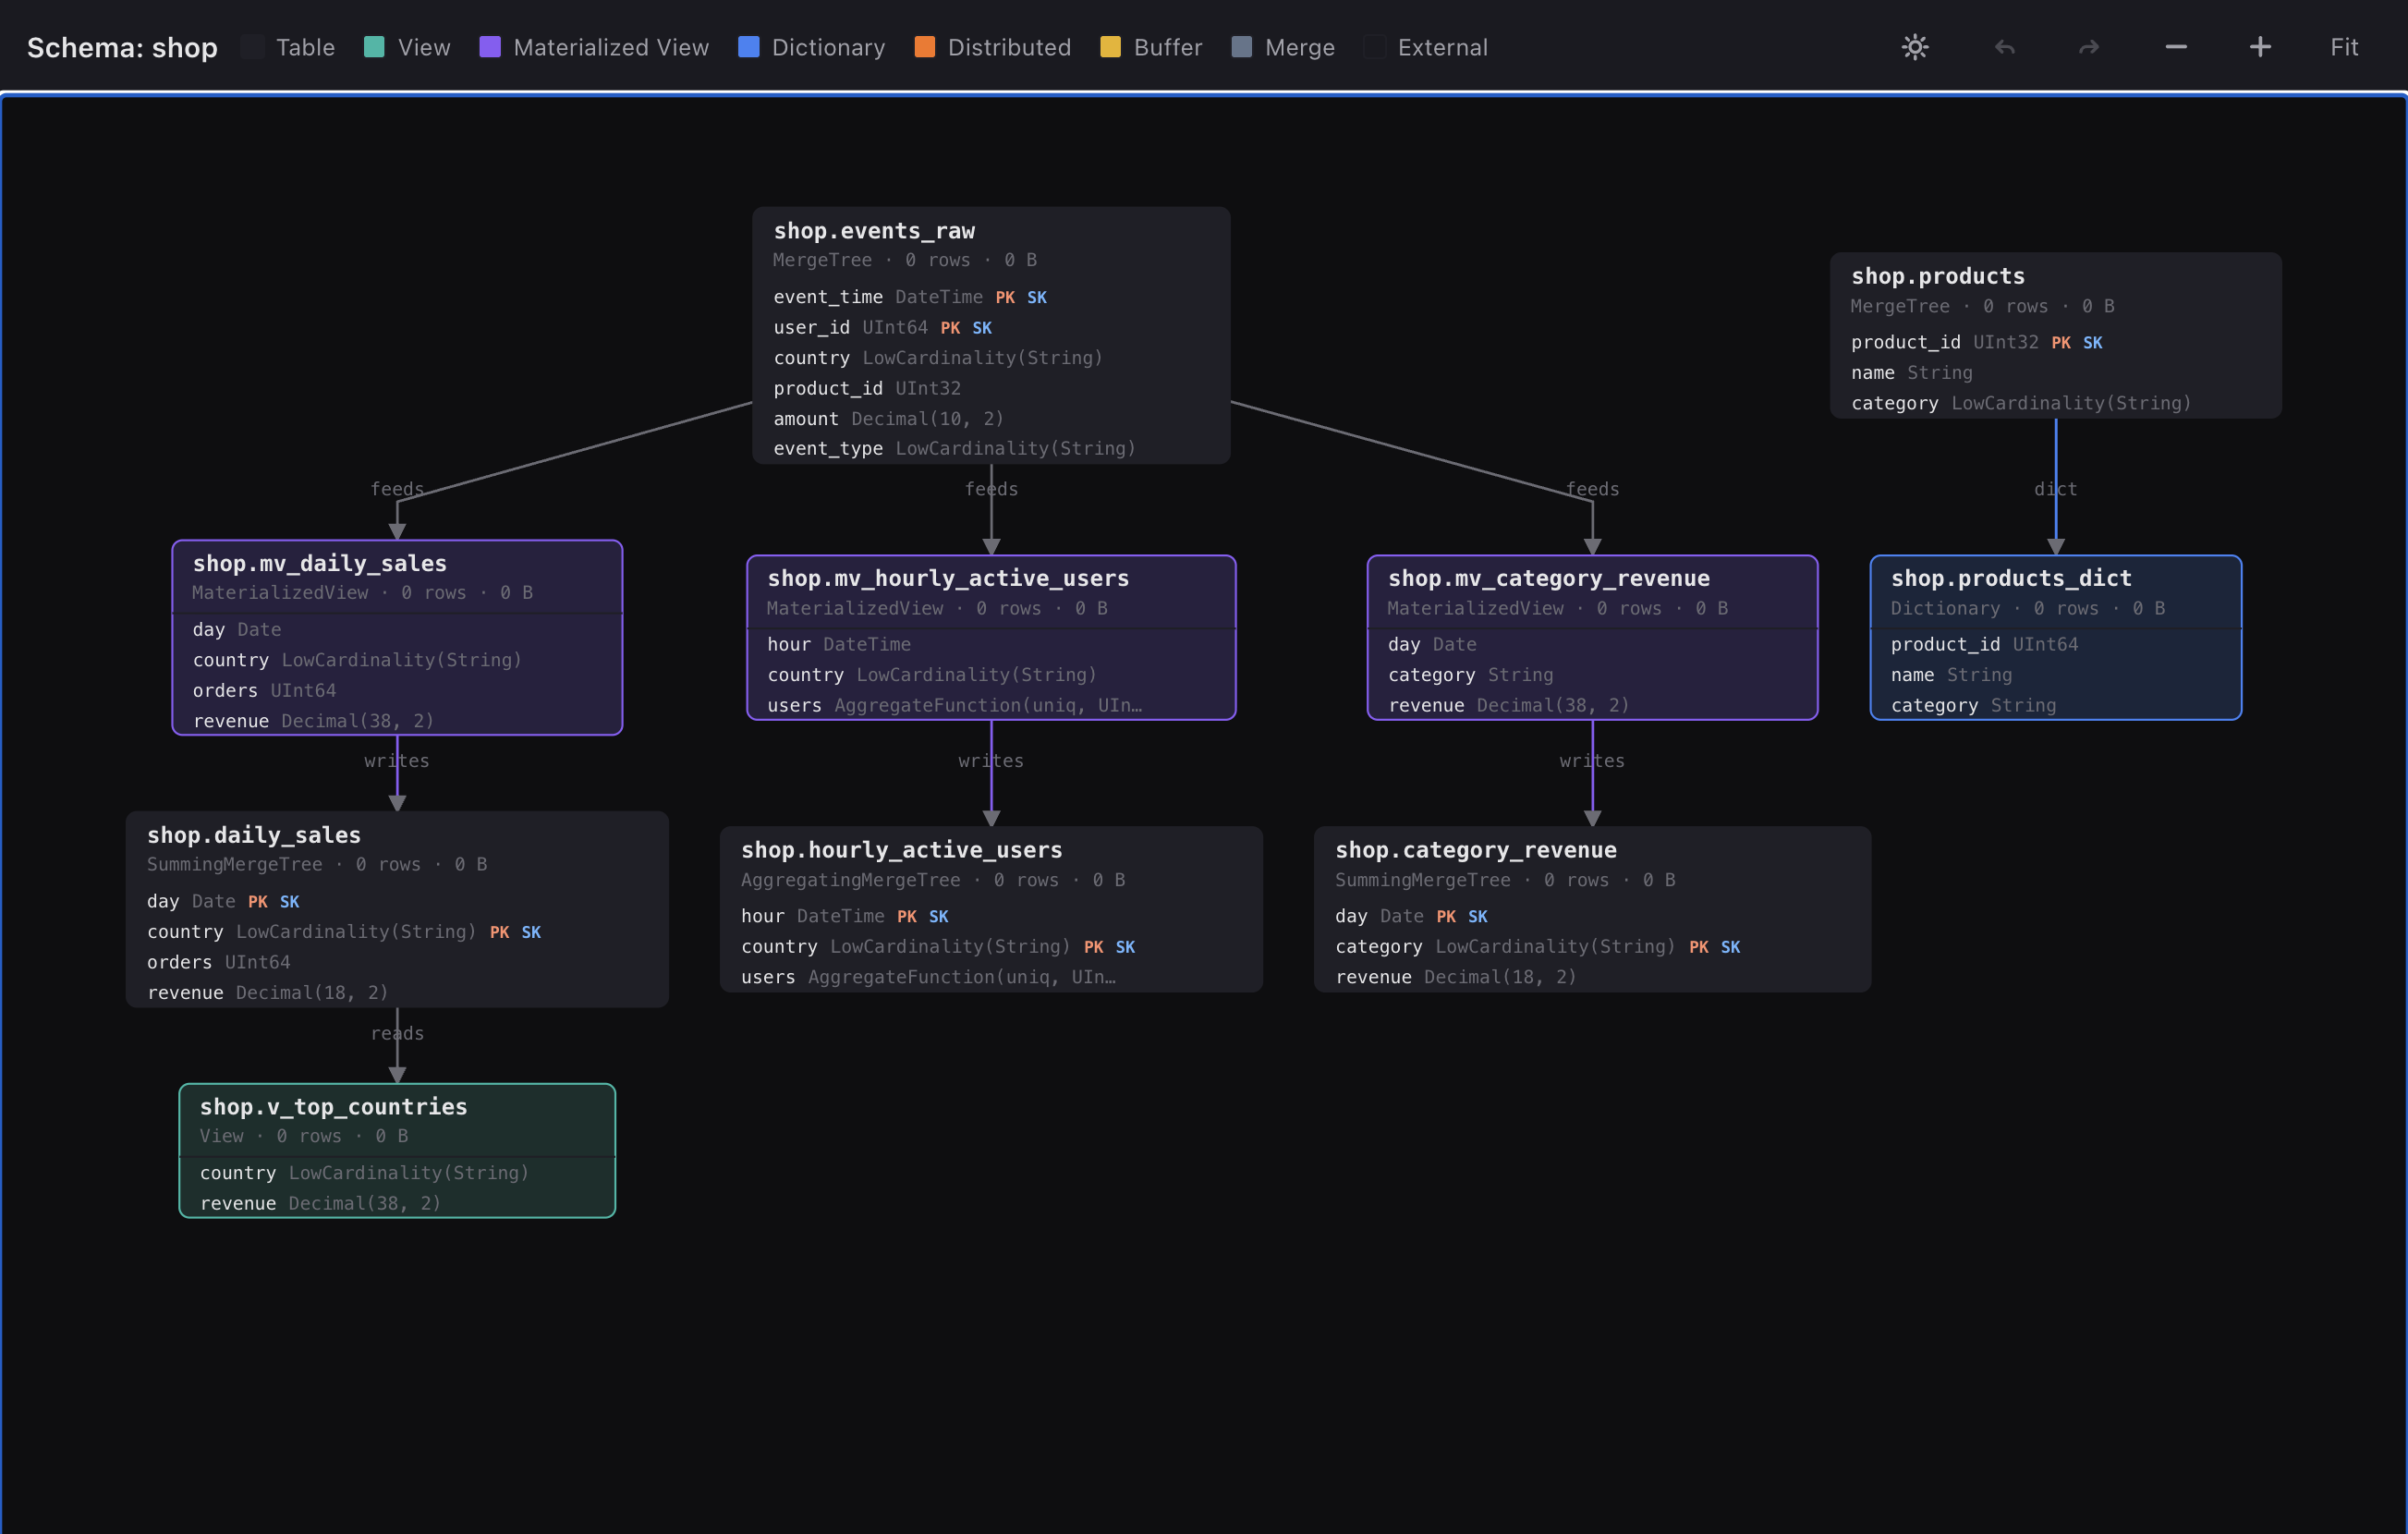
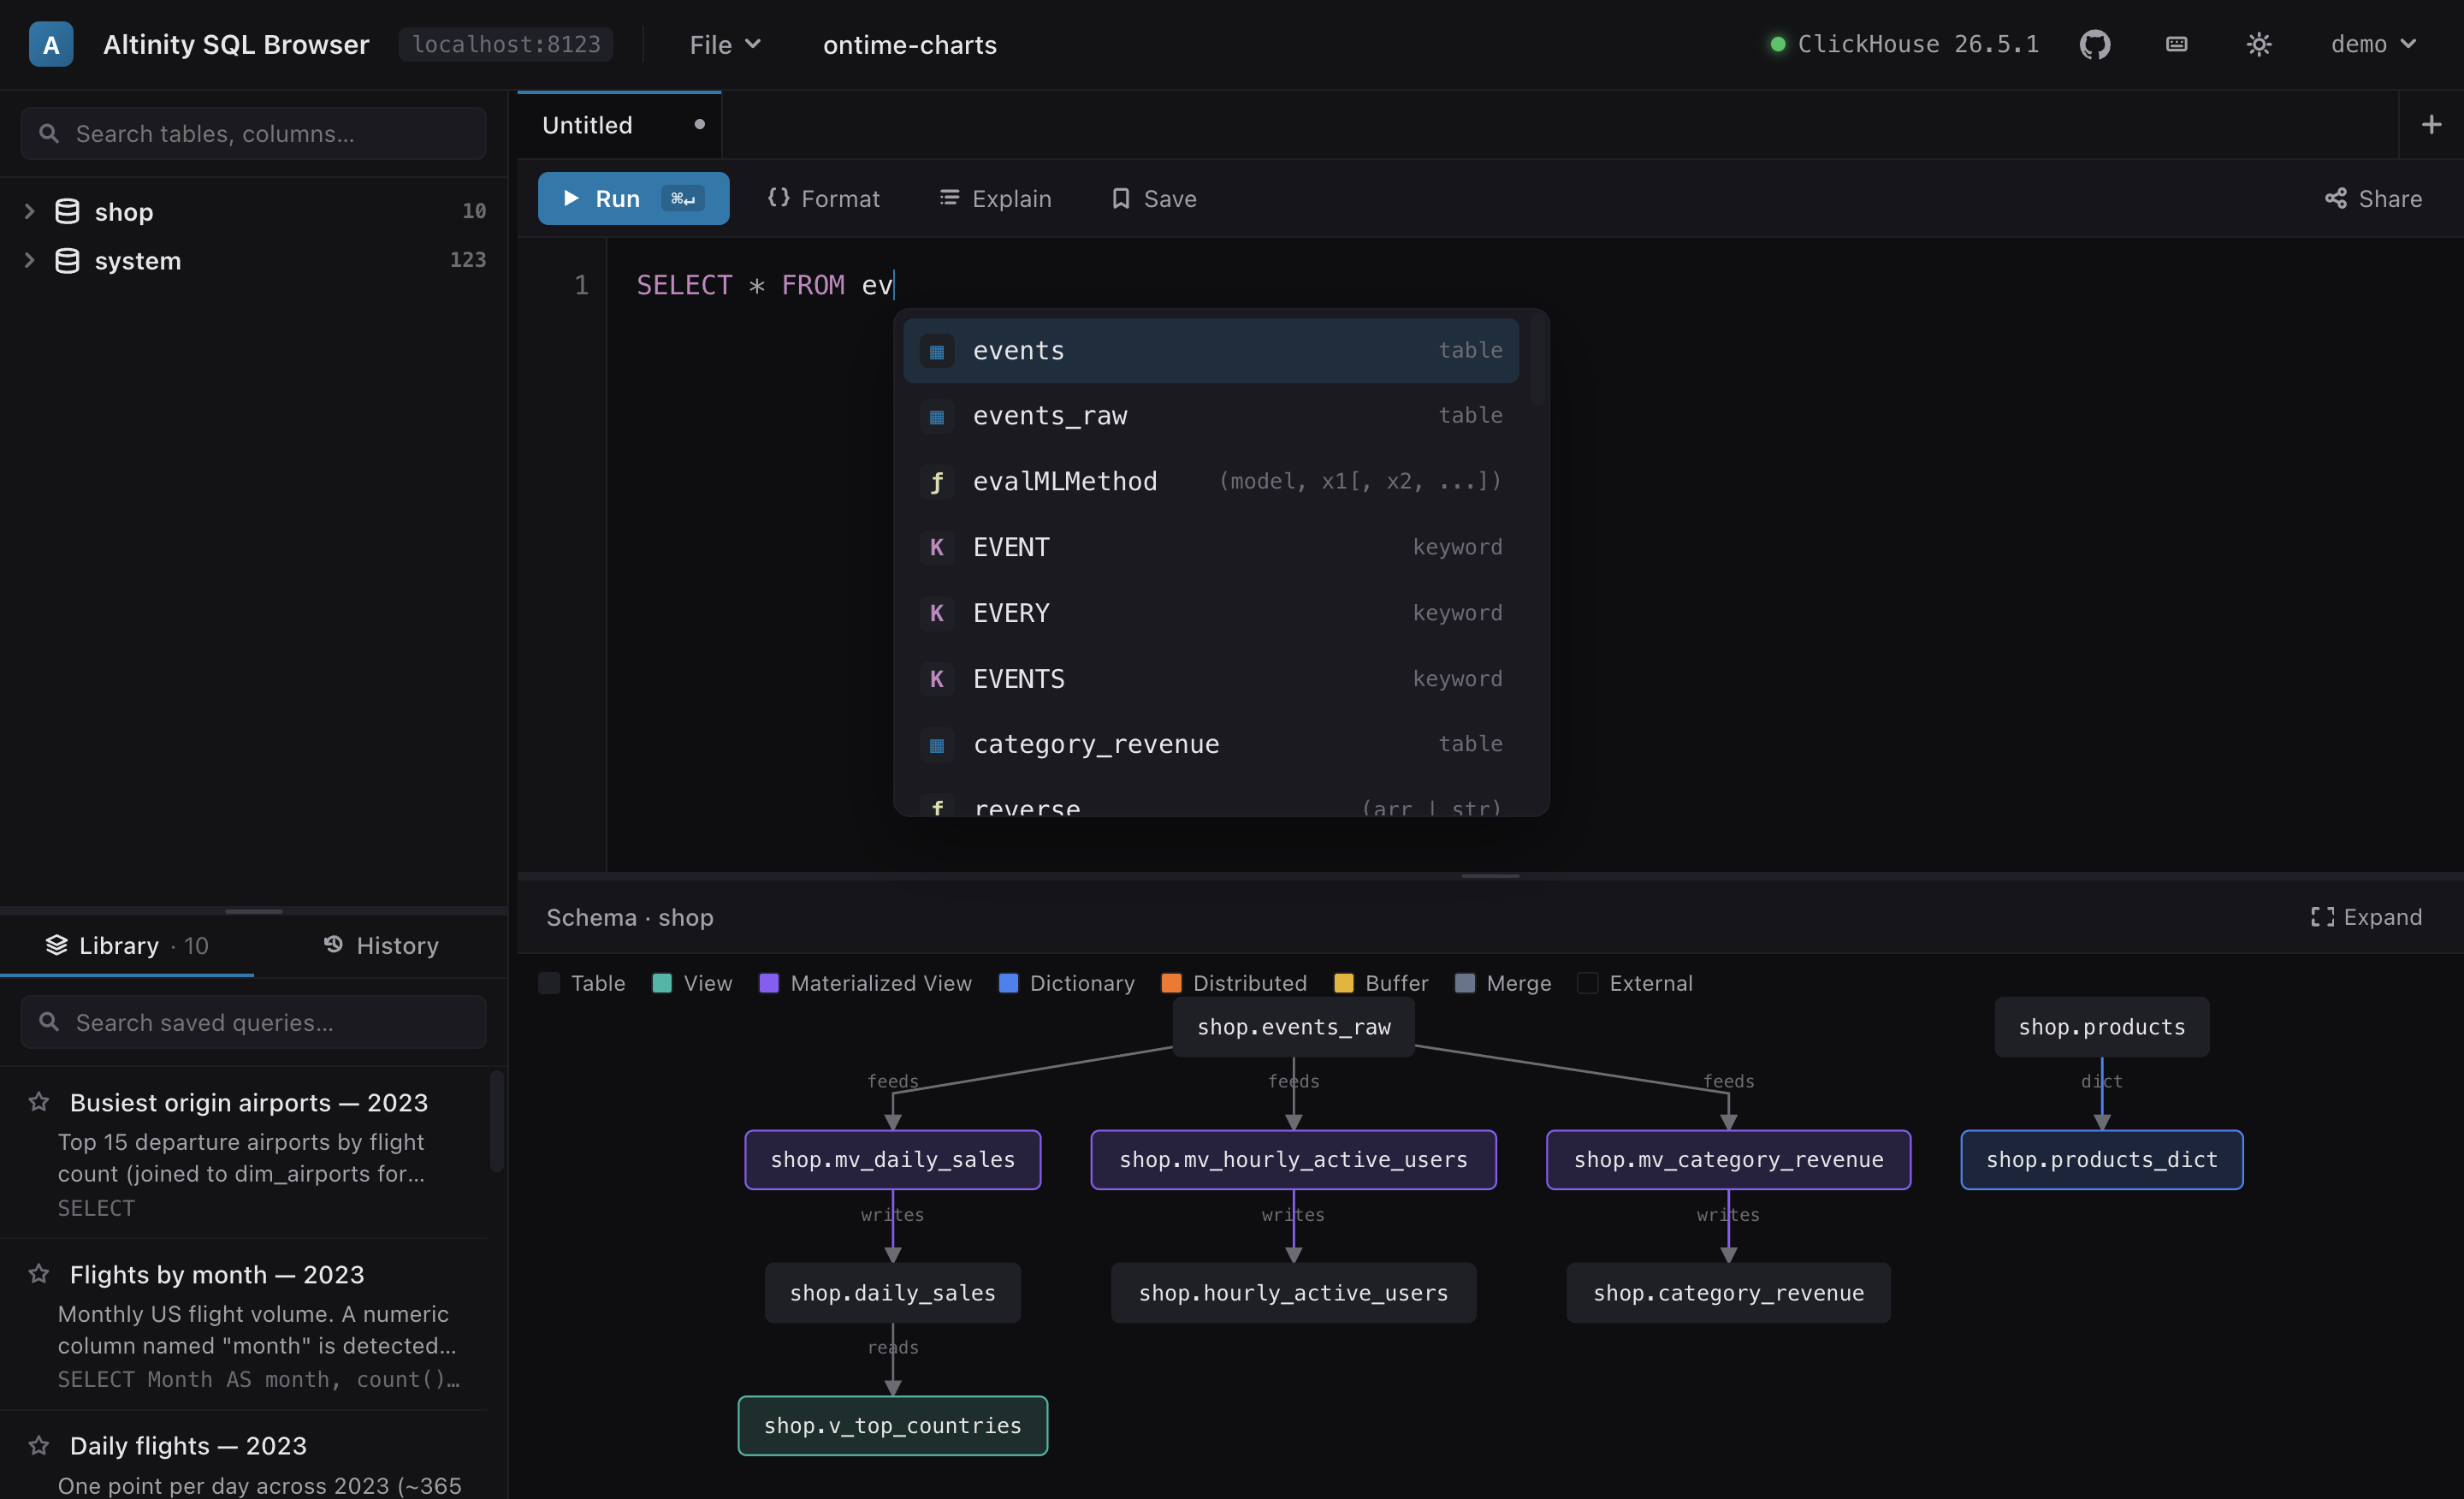
This is what sets it apart from a plain query runner. Drag a database or table in and it maps how your ClickHouse objects actually connect — then Expand opens the whole thing full-screen in its own live browser tab you can keep beside the editor.
Every object is a rich card — engine, row/byte stats and each column with its type and PK/SK badges — wired by feeds / writes / reads / dict edges.
Each node carries its engine, row/byte counts and full column list with types and PK/SK badges — covering tables, views, materialized views, dictionaries and Distributed / Buffer / Merge.
Opens in its own browser tab (kept live by the opener, so it still holds your OAuth token). Drag nodes to rearrange — with undo/redo — pan, zoom and fit. Layout persists while the tab is open.
A side pane shows full columns, keys, partitions and SHOW CREATE DDL.
Relationships are discovered transitively, across databases.
Try it on the live demo — drag the
shop database onto the results pane · see more screenshots →
Turn ad-hoc SQL into a reusable, shareable collection — each query with a title and description, searchable and star-able, saved as one portable file you can hand to a teammate or check into git.
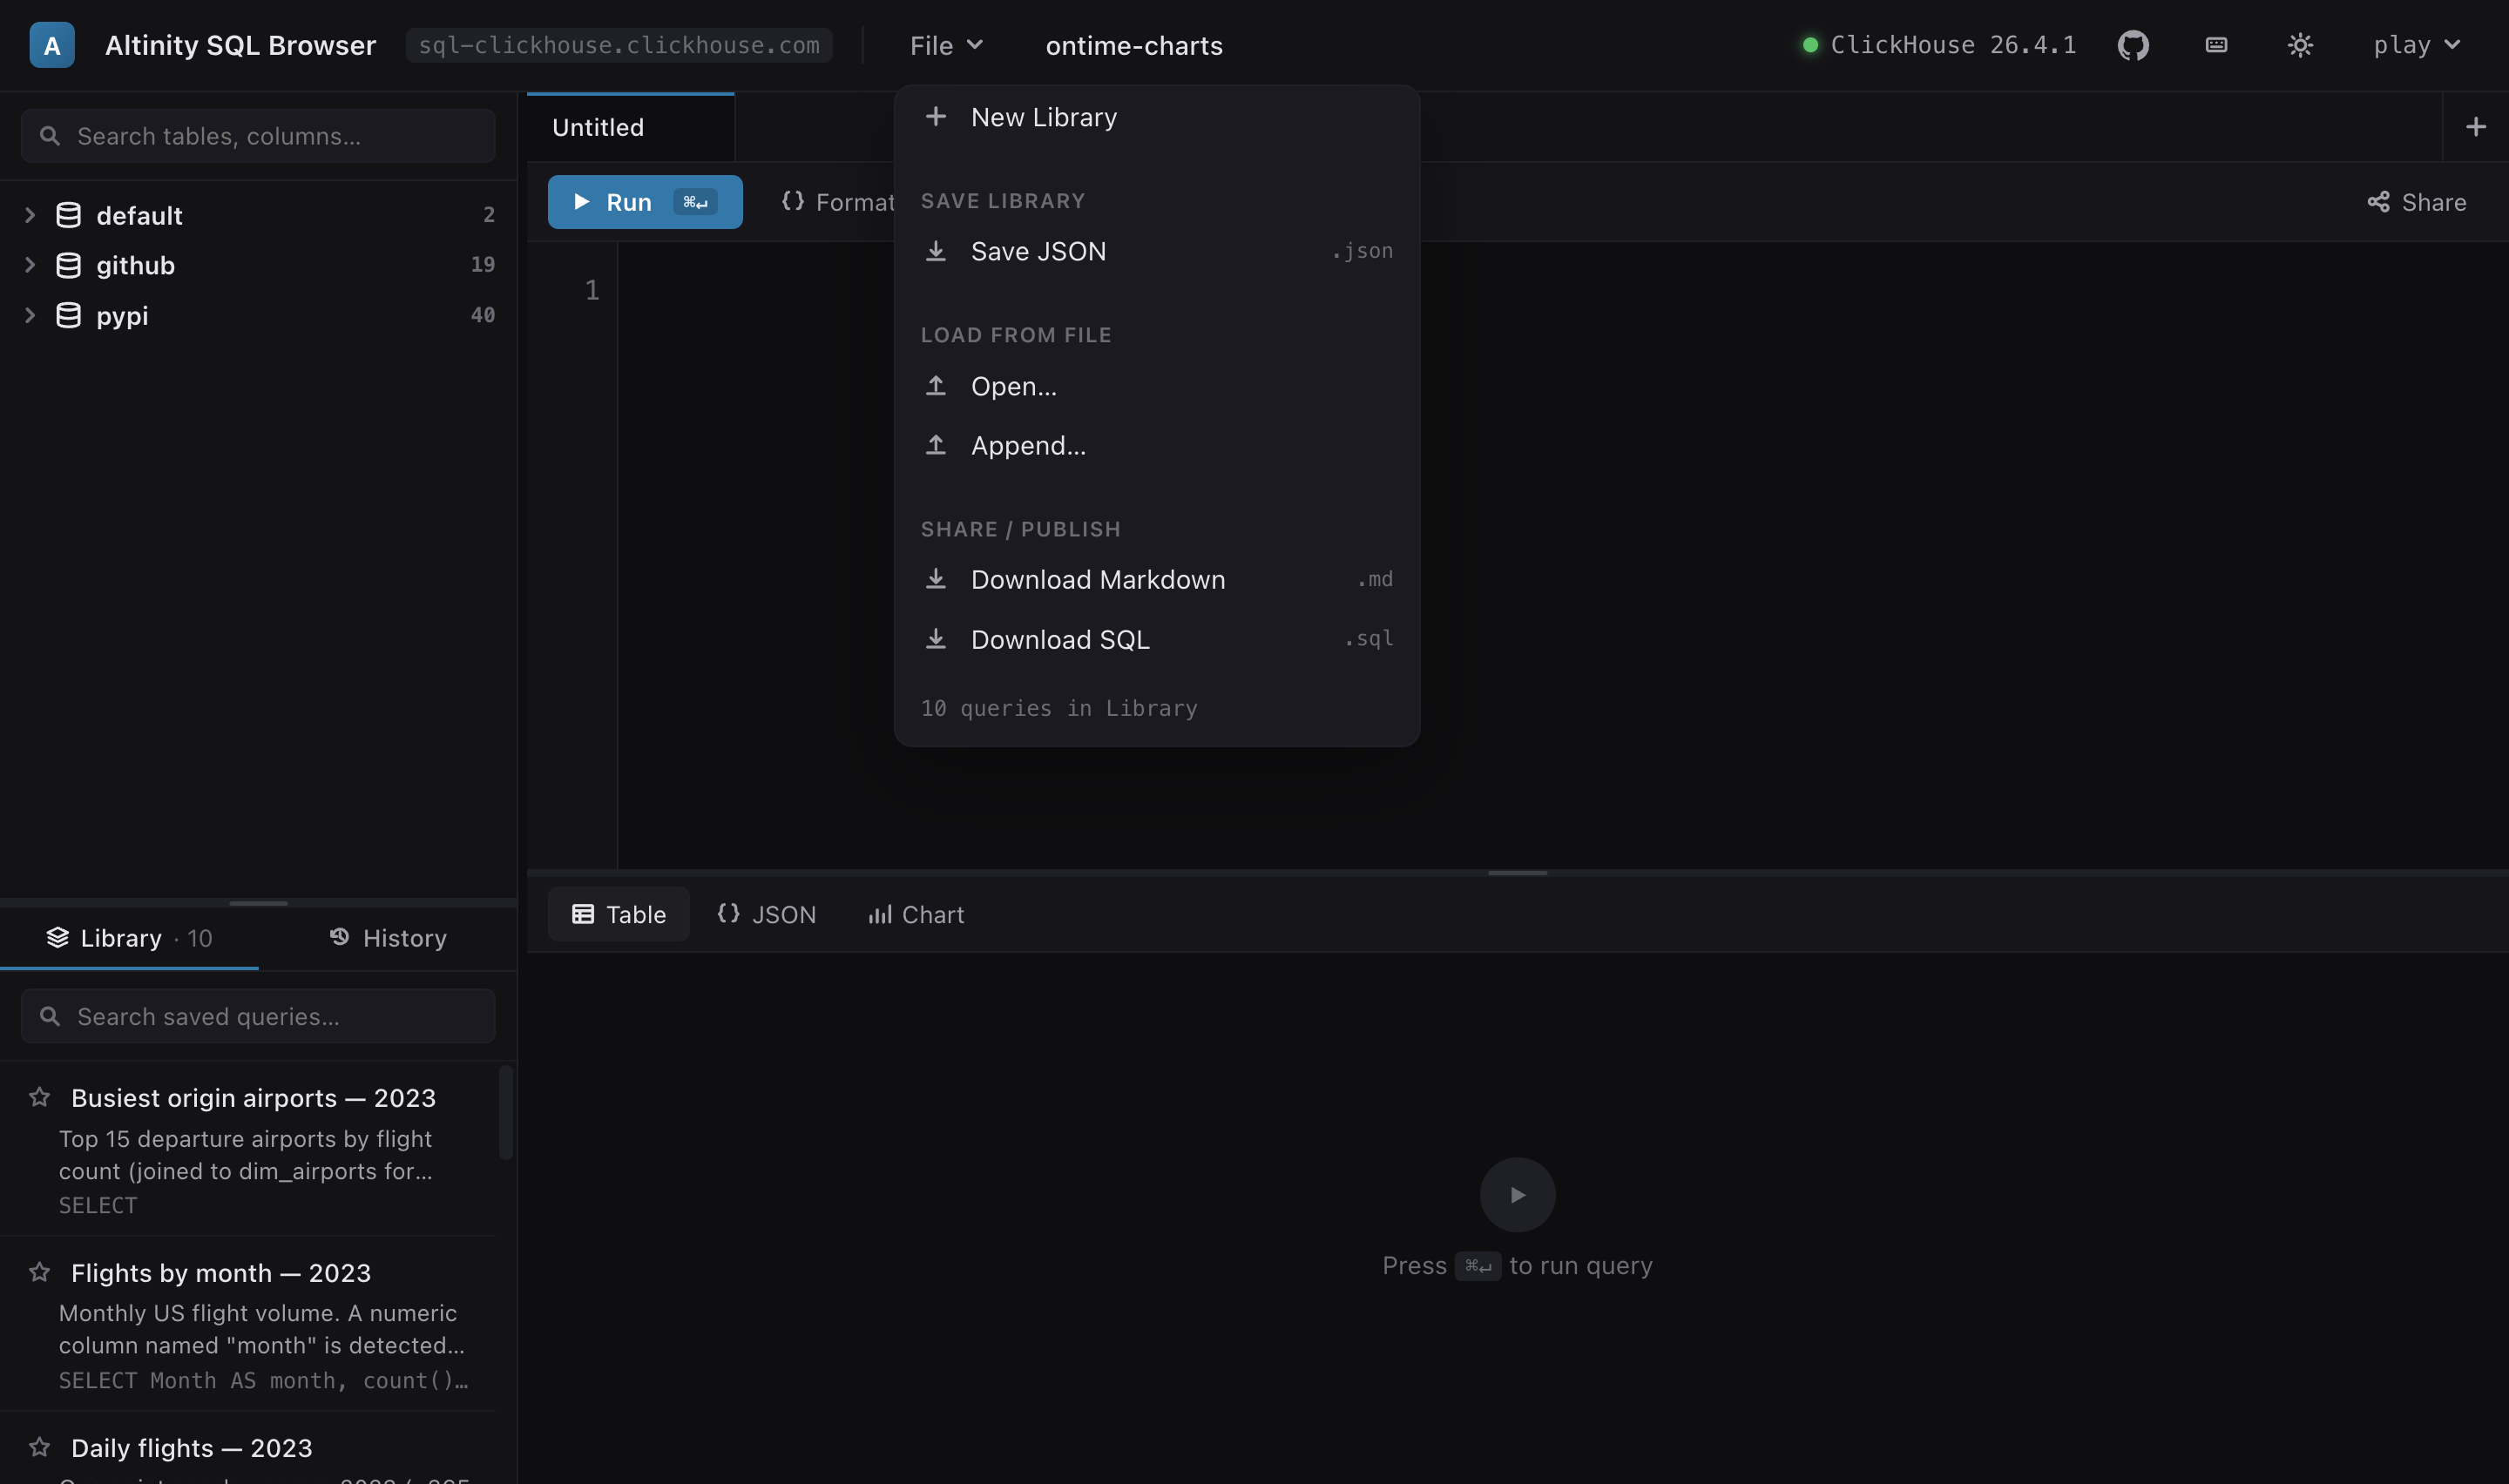
Hit Save (⌘S) to add the current query to the library with a name and an optional description. The whole library is one JSON file — Save it, Open a colleague's, or Append one into yours with smart de-duplication.

Beyond the round-trip JSON, the library exports to two human-readable formats — so it doubles as a living cookbook. Markdown gives a fenced, readable doc; SQL gives a runnable batch. The title and description travel with every query.
### heading + fenced ```sql block/* name + description */ comment then the statement
Download Markdown .md
### Flights by month — 2023 Monthly US flight volume. A numeric column named "month" is detected as an ordinal axis → vertical Column chart. ```sql SELECT Month AS month, count() AS flights FROM ontime.fact_ontime WHERE Year = 2023 GROUP BY month ORDER BY month ```
Download SQL .sql
/* Flights by month — 2023
Monthly US flight volume. A numeric column
named "month" is detected as an ordinal axis
→ vertical Column chart. */
SELECT Month AS month, count() AS flights
FROM ontime.fact_ontime
WHERE Year = 2023
GROUP BY month
ORDER BY month;
Real output from the bundled ontime-charts library — titles and descriptions preserved in both formats.
The editor reads system.keywords, system.functions and
your schema once per connection, so completion, highlighting and signature help match the exact
ClickHouse version you're on — and never fire a query on the keystroke path.

A filterable tree of databases → tables → columns with engines and row counts. Double-click to insert names; drag onto the editor or the results pane.
Copy a result as TSV (pastes straight into a spreadsheet), or stream the full result uncapped to a file. Live row, byte and elapsed-time stats sit in the result toolbar.
Encode a query (and its chart config) into a URL — open it and land on the same query. Zero server-side state.
Results stream in with a live progress bar and row/byte/time counters. Cancel a running query and keep the partial output.
Multiple query tabs, each with its own editor, result view and chart config. Resizable editor / sidebar split.
A polished design-token palette in both themes, with native OS fonts — no web-font downloads.