Viewing clusters in the ACM
You’ll spend most of your time in the Altinity Cloud Manager working with ClickHouse clusters. In this section we’ll look at the parts of the ACM user interface that make that easy. Along the way we’ll include links to more details about how to use each set of features.
The Clusters (plural) view
The Clusters view displays your ClickHouse clusters:

Figure 1 - The Clusters (plural) view, featuring two clusters
Key items in Figure 1 above include:
- The
 button, which makes it easy to
create a new ClickHouse cluster. If you’d like to
exit the tour and create a new cluster now, see the
Launch Cluster Wizard documentation.
button, which makes it easy to
create a new ClickHouse cluster. If you’d like to
exit the tour and create a new cluster now, see the
Launch Cluster Wizard documentation. - The Environment menu. Clicking on the current environment
name (
altinity-maddie-byok) displays a list of environments you can access. - The My Account menu. Clicking on your username
(
Doug Tidwell) displays a list of options for managing your account. See the My Account menu documentation for all the details of managing your account. - The clusters in this environment.
In this view there are two ClickHouse
clusters,
cluster2andmaddie-byok. Your clusters are displayed in panel view (shown) or the more compact list view. The panel view shows details about the cluster such as its resources and configuration, the version of ClickHouse it’s running, and whether backups are set up.
Clicking on a cluster name takes you to the Cluster view for that cluster. And speaking of the Cluster view….
The Cluster (singular) view
Here’s the Cluster view for the maddie-byok cluster:

Figure 2 - The Cluster (singular) view for the maddie-byok cluster
The buttons and menus across the top of the panel are:

- ACTIONS - a menu of actions you can take on this cluster. See the Cluster Actions documentation for complete details.
- TOOLS - Lets you configure a Kafka connection for this cluster.
- CONFIGURE - A menu of configuration options. See Configuring a Cluster for complete details.
- EXPLORE - Takes you to the Cluster Explorer, a panel that lets you work with data in the cluster, import data, view database schemas, and other useful things. See the Cluster Explorer guide for complete details.
- ALERTS - Lets you define alerts that should be triggered in response to certain events. See the Cluster alerts documentation for complete details.
- LOGS - Takes you to the Logs view, which contains a number of different logs to give you insight into your cluster. See the Cluster logs documentation for complete details.
- ALTINITY ACCESS - Lets you define the access privileges Altinity support personnal should have into your ClickHouse clusters. See the Altinity Access to ClickHouse documentation for complete details.
 - The cluster
lock button, which lets you prohibit any changes to the cluster.
See the Locking a cluster documentation
for all the details.
- The cluster
lock button, which lets you prohibit any changes to the cluster.
See the Locking a cluster documentation
for all the details. - The refresh
button. Refreshes the display, as you would expect.
- The refresh
button. Refreshes the display, as you would expect.
The rest of the view shows statistics and configuration information
for the cluster. Most of that data is read-only. You can, however,
change the name of the cluster owner (Doug Tidwell in Figure 2)
or the Cluster Role (Development) by clicking
the current value. You’ll get a simple dialog that lets you
set a new value.
The Connection Details link highlighted in Figure 2 shows you the
hostname, ports, and other details
you’ll need to connect to your ClickHouse cluster from
an application, a monitoring tool, or the clickhouse-client
tool:

The Nodes (plural) view
Clicking the Nodes tab highlighted below the cluster name at the top of Figure 2 above shows you the list of nodes in this cluster:
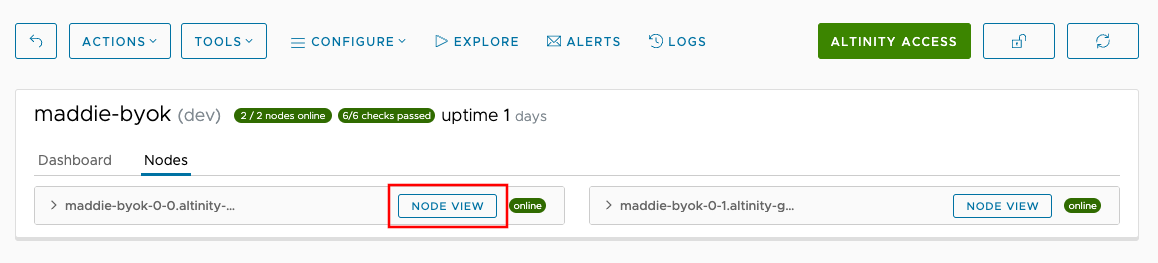
Figure 4 - The Nodes (plural) view for a cluster
Clicking the NODE VIEW button above takes you to, well, the view of a single node.
The Node (singular) view
The view of a single node looks like this:

Figure 5 - The Node (singular) view
The buttons across the top of the panel are:
- ACTIONS - The ACTIONS menu has two items:

- Restart - Restarts the node.
- Exclude from Load Balancer - Excludes this node from the
load balancer, as you would expect. Selecting this item means
that the node will not get any traffic from the load balancer.
(You can still access the node directly if you have its
connection information as shown in Figure 6 below.) When a
node is removed from the load balancer, the text of this menu
item becomes Include in Load Balancer; clicking
that item returns the node to the load balancer. The value of
LB Status in the display is
IncludedorExcludedas appropriate:
- EXPLORE - Takes you to the Cluster Explorer for this node. This is the same Cluster Explorer available from the Cluster view, but it is scoped to work with the current node only. See the Cluster Explorer guide for complete details.
- STORAGE - Lets you view, modify, and manage the storage used by this node. See the Configuring storage documentation for complete details.
- VIEW LOGS - Takes you to the Logs view, which contains a number of different logs to give you insight into your cluster. See the Cluster logs documentation for complete details.
Clicking the Connection Details link highlighted in Figure 5 above shows the information you need to connect directly to this node:

This dialog is similar to Figure 3 above, the difference being that the host is the URL for this node, not the entire cluster. Depending on how you have configured replication and sharding, connecting to an individual node may be useful.